Details
-
Type:
 Improvement
-
Status: Closed
-
Priority:
 Major
Major
-
Resolution: Fixed
-
Affects Version/s: 1.8RC1
-
Component/s: ICE-Components
-
Labels:None
-
Environment:All
-
Affects:Documentation (User Guide, Ref. Guide, etc.)
Description
http://jcharts.sourceforge.net/samples/scatter.html
Activity
| Field | Original Value | New Value |
|---|---|---|
| Summary | Add scatter chat to charts component | Add scatter chart to charts component |
| Salesforce Case | [50070000007yhWQ] |
| Attachment | AxisChart.java [ 11527 ] | |
| Attachment | OutputChart.java [ 11528 ] | |
| Attachment | chart.jpg [ 11529 ] |
| Fix Version/s | 1.8 [ 10161 ] | |
| Affects | [Documentation (User Guide, Ref. Guide, etc.)] | |
| Assignee Priority | P2 | |
| Assignee | Adnan Durrani [ adnan.durrani ] |
| Repository | Revision | Date | User | Message |
| ICEsoft Public SVN Repository | #18394 | Sun Feb 22 18:24:53 MST 2009 | adnan.durrani | fix for |
| Files Changed | ||||
 MODIFY
/icefaces/trunk/icefaces/component/src/com/icesoft/faces/component/outputchart/OutputChart.java
MODIFY
/icefaces/trunk/icefaces/component/src/com/icesoft/faces/component/outputchart/AxisChart.java
MODIFY
/icefaces/trunk/icefaces/component/src/com/icesoft/faces/component/outputchart/OutputChart.java
MODIFY
/icefaces/trunk/icefaces/component/src/com/icesoft/faces/component/outputchart/AxisChart.java
|
Provided patch applied.
Modified: D:\work\development\head\svn\ossrepo\icefaces\trunk\icefaces\component\src\com\icesoft\faces\component\outputchart\AxisChart.java
Modified: D:\work\development\head\svn\ossrepo\icefaces\trunk\icefaces\component\src\com\icesoft\faces\component\outputchart\OutputChart.java
Sending content: D:\work\development\head\svn\ossrepo\icefaces\trunk\icefaces\component\src\com\icesoft\faces\component\outputchart\OutputChart.java
Sending content: D:\work\development\head\svn\ossrepo\icefaces\trunk\icefaces\component\src\com\icesoft\faces\component\outputchart\AxisChart.java
Completed: At revision: 18394
| Status | Open [ 1 ] | Resolved [ 5 ] |
| Resolution | Fixed [ 1 ] |
I found a few issues with what i previously submitted. So thought i'd update it here just in case you didn't find them. specifically look for garpinc in source for changes.. changes are related to using NaN for points not to be displayed, using 2DoubleArray.
| Attachment | AxisChart.java [ 11537 ] |
Perhaps you also have a good way of meeting this request:
for each point I need the title to be more flexible than just a now currently hard coded legend.
for each point instead I want to be able to specify a title format like
{legend} ({pointLabels}) {xLabel} = {xValue}, {yLabel} = {yValue}usage as follows:
<ice:outputChart
pointLabelsMethod="${managedBean.pointLabels}"
pointTitleFormat="{legend}
(
{pointLabels}):
{xLabel}=
{xValue},
{yLabel}=
{yValue}"
resulting in a title like:
Label0 (1,2): xaxis = 25.0, yaxis = 50.0
and where this would indicate that at 25,50 coordinate there are two points with the very same coordinates with labels "1" and "2"
and "1" and "2" are derived by calling managedBean.pointLabels method passing in the x and y coordinate for the point.
one way of passing x and y is having managedBean.pointLabels be a map where the first get just sets x value and returns another map where the get of y value sets y and then the final Set of labels is returned from the final get call.
Also:
in OutputChart there appears to be a problem with imagemap and data sets with conflicting (i.e: equal datapoints). I got all kinds of hanging and also where it worked in Firefox albiet slow it completely hung in ie.
It cannot be handled at the data level since for instance you want to show a polygon and a circle to indicate there are 2 points. But when calulating the image map these duplicate points should be suppressed.. i.e:
Set coordinates = new HashSet();
while (area.hasNext()) {
ImageMapArea areaMap = (ImageMapArea) area.next();
StringBuffer coordinateBuf = new StringBuffer();
areaMap.getCoordinates(coordinateBuf);
//garpinc only add if coordinate has not already been added.
if (coordinates.add(coordinateBuf.toString())) {
| Fix Version/s | 1.8RC2 [ 10163 ] | |
| Fix Version/s | 1.8 [ 10161 ] |
Keith, please create new JIRA issues for these follow-up bugs not related to adding the scatter chart support.
Keith Garry`s patch applied. Changes are related to using NaN for points not to be displayed, using 2DoubleArray
Modified: D:\work\development\head\svn\ossrepo\icefaces\trunk\icefaces\component\src\com\icesoft\faces\component\outputchart\AxisChart.java
Sending content: D:\work\development\head\svn\ossrepo\icefaces\trunk\icefaces\component\src\com\icesoft\faces\component\outputchart\AxisChart.java
Completed: At revision: 18621
Hi,
Is it possible to add the radar chart too ?
Regards,
| Fix Version/s | 1.8 [ 10161 ] | |
| Assignee Priority | P2 |
| Status | Resolved [ 5 ] | Closed [ 6 ] |
| Assignee | Adnan Durrani [ adnan.durrani ] |
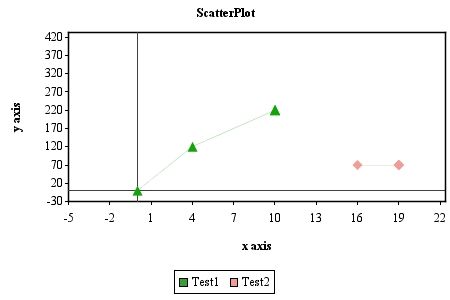
Attached are the customer's source files that implement this functionality. For instance:
<ice:outputChart id="axialOutputChart"
{clientHandler.chartAreaClicked}type="scatterplot"
actionListener="#
"
chartTitle="ScatterPlot"
xaxisTitle="x axis"
yaxisTitle="y axis"
renderOnSubmit="true"
xaxisLabels="-5,3,10,0,-30,50,10,1"
labels="Test1,Test2"
data="0,0,4,120,10,220:16,70,19,70"
width="450" height="300"/>