Details
-
Type:
 Bug
Bug
-
Status: Closed
-
Priority:
 Major
Major
-
Resolution: Fixed
-
Affects Version/s: 1.8.2-EE-GA_P01
-
Fix Version/s: 1.8.3, 1.8.2-EE-GA_P02
-
Component/s: Framework
-
Labels:None
-
Environment:IE 6
Description
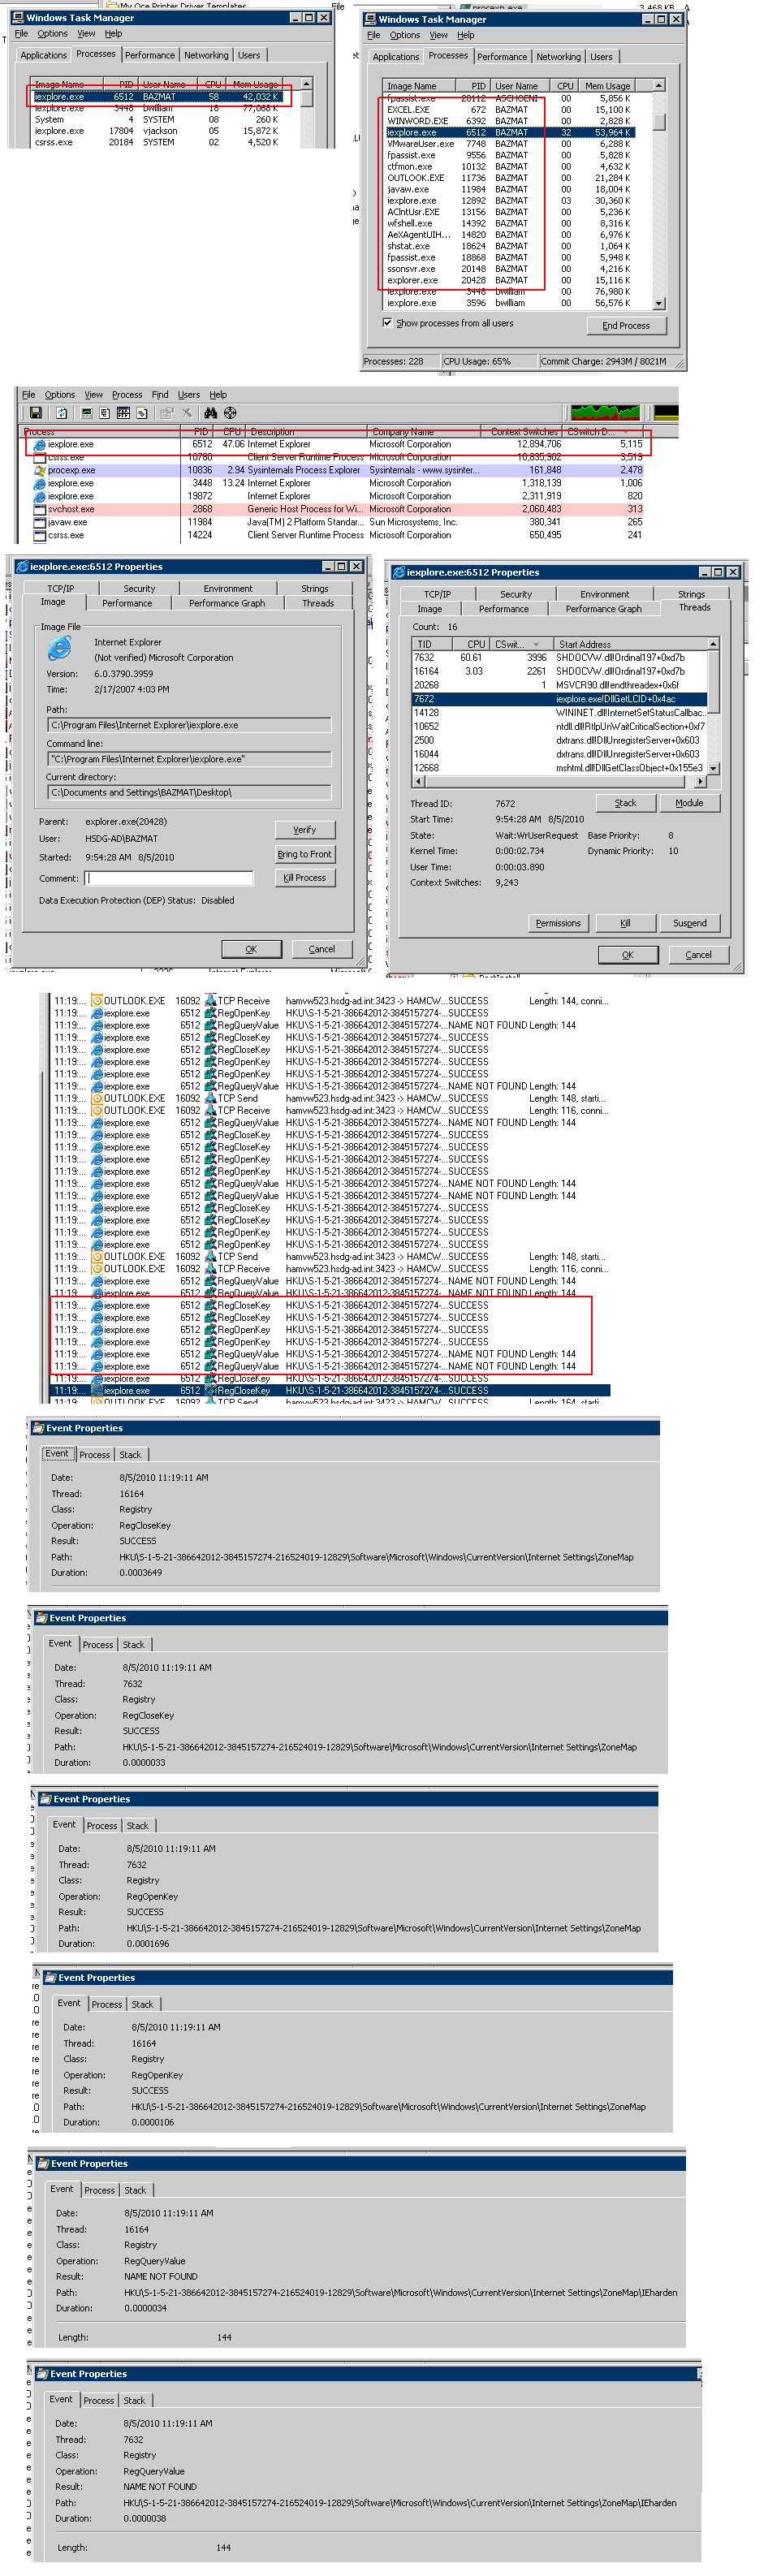
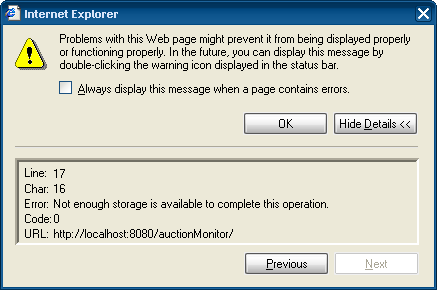
1. open http://localhost:8080/auctionMonitor/
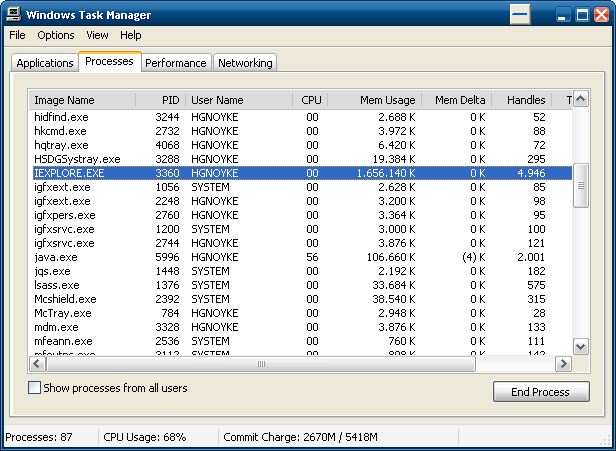
Task Manager (IExplore.exe): Memory Usage ~ 43000 k
2. Click on "Application Link"
Task Manager (IExplore.exe): Memory Usage ~ 52500 k
3. Close Popup Window
Task Manager (IExplore.exe): Memory Usage ~ 47300 k
4. Click on "Application Link"
Task Manager (IExplore.exe): Memory Usage ~ 54000 k
5. Close Popup Window
Task Manager (IExplore.exe): Memory Usage ~ 49200 k
Repeating the last two steps over and over again leads to a steady increase in memory with all browsers. When the browser window is closed, all process memory is released.
Attached is a modified AuctionMonitor.jspx containing the following code to open the new window popup:
<ice:commandLink window.open('index.jsp','secondAppWindow','status=no,resizable=no,scrollbars=no,toolbar=no,menubar=no,top=0,left=0,width=1024,height=738');">
Activity
- All
- Comments
- History
- Activity
- Remote Attachments
- Subversion
Which version of FF are you using, which OS?
I am using FF 3.6.9. on Windows XP Professional Service Pack 3.
I managed squeeze another improvement in IE's memory consumption. This time I changed the anonymous functions that are passed into setInterval() native function to named functions. Apparently the anonymous functions capture the window environment when created thus automatically creating a reference to the 'window' object, references that prevent IE from collecting the registered closures.
The results are as follow:
- start - 29Mb
- after 8 hours running: 111Mb
- minimizing main window: 35Mb
- after 1 hour: 45Mb
- minimizing main window: 35Mb
So, it seems that IE is behaving reasonably well. I'm not sure I can improve the memory usage anymore.
Additional tests confirm the latest memory usage pattern.
This issue is considered fixed now.
I have now tested the new patch with the auction monitor sample application.
There are no recognizable differences compared to the previous version.
I also tested the scenario you mentioned with minimizing the IE window in between.
- start - 33 MB
- 4,5 hrs: 137MB
- minimizing main window: 102 MB
- 7 hrs: 170MB
- minimizing main window: 150 MB
So the memory consumption is still growing.
When opening links manually the memory consumption on my machine is reasonable. I'll wait for the results from our Citrix environment and then feedback to you.
Automated tests on Citrix environment showed no improvement, but manual tests showed that the leak is fixed. I am now doubting the test setup.
The automated opening and closing of windows via JS functions also seems to stil produce a leak, but the manual test in the ICEfaces examples show that the memory consumption is reasonable now. Therefore I also consider this issue fixed.
Thank you again!
I managed to reproduce IE's increasing in memory usage by using the provided jspx page. Every time a new window is opened there's an increase of ~7Mb in memory usage, once the window is closed there's about ~4Mb of memory released. So, after each window open/close cycle there's an increase in memory of ~3Mb ( = 7Mb - 4Mb).
I took the test a bit further and automated the opening and closing of windows. This way the open/close cycle was run every 7 seconds. After running the test for about 15 minutes I was seeing the memory usage reach a certain maximum threshold, on the machine I was running was 350Mb, once this threshold reach IE would release the memory aggressively to about 200Mb (very similarly to a garbage collection). From then on again the memory usage will increase gradually until reaching the threshold and going back again.
I was able to run the window ope/close cycle every 7 seconds for hours without having IE freeze or crash, every time repeating the pattern described above.
So, in conclusion I believe there is no real memory leak but just a false alarm due to IE's memory usage behavior. Actually we've seen this behavior in the past, such as for DOM updates, which prompted us to verify if really there is a memory leak by pushing IE to reach the memory threshold.