Details
-
Type:
 Bug
Bug
-
Status: Closed
-
Priority:
 Major
Major
-
Resolution: Fixed
-
Affects Version/s: 1.8.2-EE-GA_P01
-
Fix Version/s: 1.8.3, 1.8.2-EE-GA_P02
-
Component/s: Framework
-
Labels:None
-
Environment:IE 6
Description
1. open http://localhost:8080/auctionMonitor/
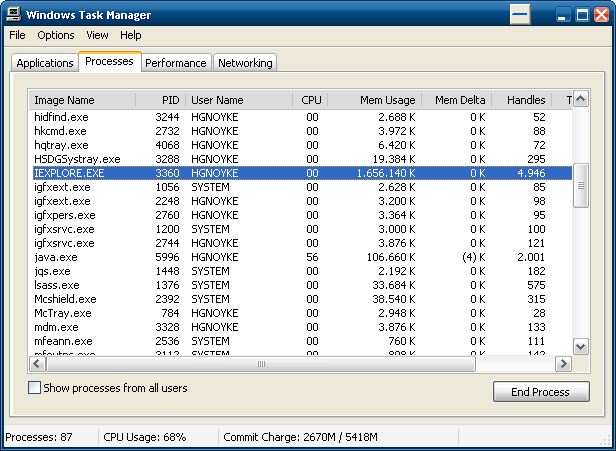
Task Manager (IExplore.exe): Memory Usage ~ 43000 k
2. Click on "Application Link"
Task Manager (IExplore.exe): Memory Usage ~ 52500 k
3. Close Popup Window
Task Manager (IExplore.exe): Memory Usage ~ 47300 k
4. Click on "Application Link"
Task Manager (IExplore.exe): Memory Usage ~ 54000 k
5. Close Popup Window
Task Manager (IExplore.exe): Memory Usage ~ 49200 k
Repeating the last two steps over and over again leads to a steady increase in memory with all browsers. When the browser window is closed, all process memory is released.
Attached is a modified AuctionMonitor.jspx containing the following code to open the new window popup:
<ice:commandLink window.open('index.jsp','secondAppWindow','status=no,resizable=no,scrollbars=no,toolbar=no,menubar=no,top=0,left=0,width=1024,height=738');">
Activity
| Field | Original Value | New Value |
|---|---|---|
| Salesforce Case | [5007000000D3SXr] |
| Attachment | auctionMonitor.jspx [ 12471 ] |
| Assignee Priority | P1 | |
| Assignee | Mircea Toma [ mircea.toma ] |
| Status | Open [ 1 ] | In Progress [ 3 ] |
| Status | In Progress [ 3 ] | Resolved [ 5 ] |
| Resolution | Fixed [ 1 ] |
Here's the script that automates the window open/close cycle:
<script type="text/javascript">
setInterval(function() {
var w = window.open('auctionMonitor.iface','secondAppWindow','status=no,resizable=no,scrollbars=no,toolbar=no,menubar=no,top=0,left=0,width=1024,height=738');
setTimeout(function()
, 4000);
}, 7000);
</script>
Thanks for the script, I am now running the tests myself.
Which version of IE did you use? We are using IE 6 SP3. My first test reached 350 Mb with the Internet Explorer, but then it does not respond anymore and needs to be killed.
Did you also run the tests with Firefox? I am still running tests with FF, and my Firefox is already using ~750 Mb and is not willing to free any of it yet...
I don't think we can equip our client PCs with such high amount of memory only for the application running in the browser...
Is there any way to reduce the maximum memory consumption on IE so that the mentioned "aggressive" garbage collection will be initiated earlier than at 350 Mb used memory (or even a limit relative to the machines equipment)?
There is an article in Microsofts KB providing a hotfix for the garbage collection: http://support.microsoft.com/kb/942840/en But I still need to check whether this may help in our case. As we experienced that this also occurs with IE 8 and the GC should work already better there I am not sure if this helps...
Best Regards,
Harm
I used IE7 for testing. I will try to use IE6 and see how it behaves.
Firefox does use a lot of memory but not in a upward trend, ~500Mb is the maximum limit. Keep in mind that these values change depending on how much memory the system has available...this is true for IE and Firefox.
Anyway, I am guessing that this high memory usage can be blamed on the add-ons that the Firefox installation might have. When running Firefox in safe mode the memory usage stays firmly at 67Mb. Here's how to enable safe mode for Firefox: http://support.mozilla.com/en-us/kb/safe+mode
| Resolution | Fixed [ 1 ] | |
| Status | Resolved [ 5 ] | Reopened [ 4 ] |
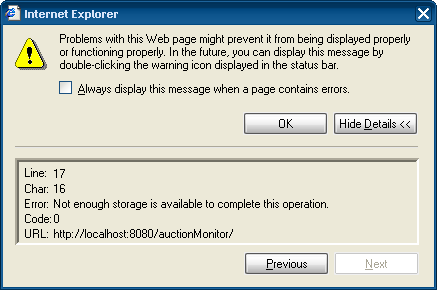
IE 6 SP3 consumes up to 1.6 Gb on my machine and then gets an out of memory error in the Javascript call to open the new window.
I am still checking whether the JavaScript engine can be switched, if the process can be limited somehow in memory usage, and also how Firefox behaves in "Safe Mode".
Also I think that the memory reduction by the aggressive garbage collection you described earlier from 350 Mb to 200 Mb does not sound good. If there are any DOM elements which are only cleaned up then, which are these? Why can't the browser clean up more memory? If he can clean up why is the memory consumption still so far away from the initial memory consumption (200 Mb after GC vs. ~40 Mb initally)?
| Attachment | task_manager.png [ 12482 ] | |
| Attachment | JS_memory_error.png [ 12483 ] |
The JS engine in my browser is already the newest for IE6 (5.7). So there is no room for improvements here.
Firefox in SafeMode keeps allocating memory, the increase is just slower here.
What I found out to improve our "workaround" (which is closing the browser...) is that with IE 6 the memory is released when the browser windows are minimised. Plus the memory is on a lower level when the windows are restored. This is quite interesting and does not show in the other browsers tested (IE8, FF 3.6).
Still, my questions from the previous post remain.
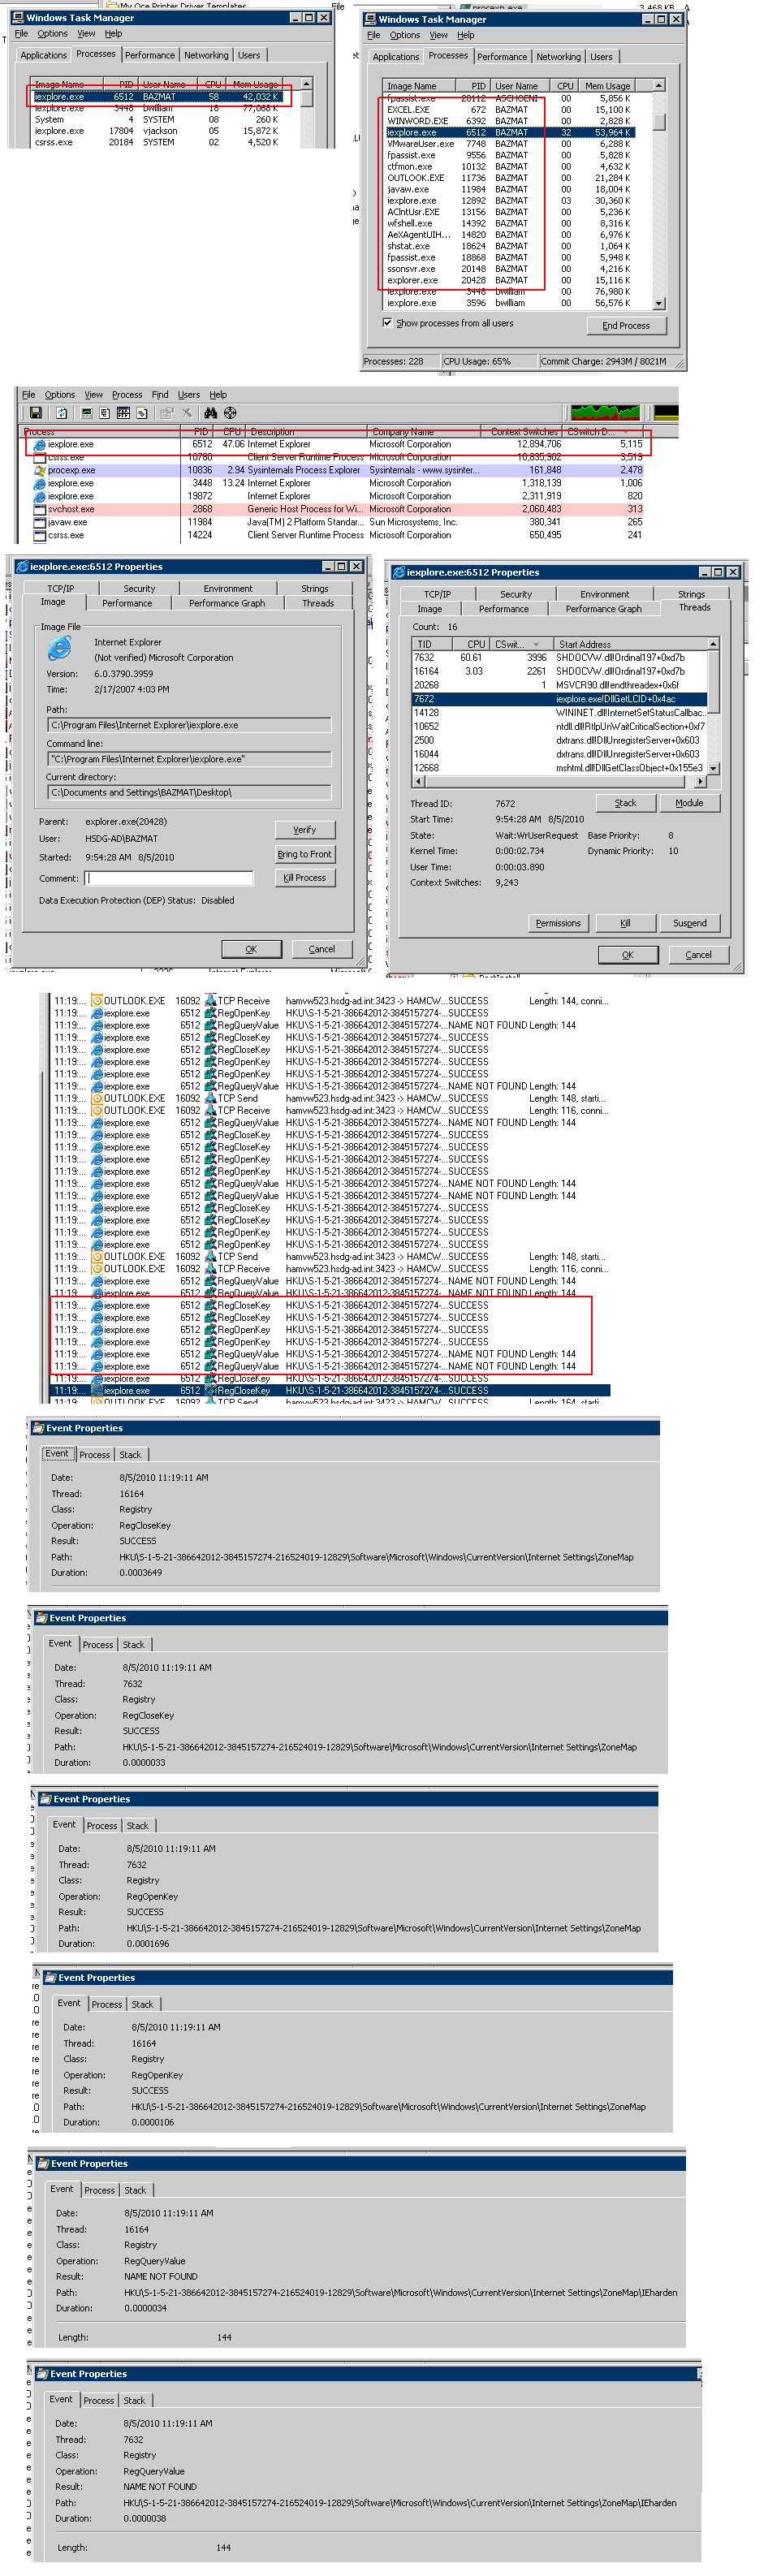
I will add screenshots showing the process explorer state on our Citrix farms when the Internet Explorer is in an unresponding state. Maybe this helps you with the analysis.
screenshots from the process explorer on the citrix farm when the system is responding badly.
1. Task Manager
2. Process Explorer (IE highlighted)
3. Process Properties
4. Event Log (showing many repeating requests of ie to the registry)
| Attachment | ie_citrix.PNG [ 12484 ] |
> IE 6 SP3 consumes up to 1.6 Gb on my machine and then gets an out of memory error in the Javascript call
> to open the new window.
How long have you been running the test?
> I am still checking whether the JavaScript engine can be switched, if the process can be limited somehow
> in memory usage, and also how Firefox behaves in "Safe Mode".
I don't think you can change the Javascript engine in IE. Lots of people would have done it by now since IE has a lot of limitation that everybody tries to overcome.
> Also I think that the memory reduction by the aggressive garbage collection you described earlier from
> 350 Mb to 200 Mb does not sound good. If there are any DOM elements which are only cleaned up then,
> which are these?
The event listeners of the updated elements are cleaned everytime. The memory leak occurs even when the JS code doesn't apply any updates.
> Why can't the browser clean up more memory?
I wish I knew...
> If he can clean up why is the memory consumption still so far away from the initial memory consumption
> (200 Mb after GC vs. ~40 Mb initally)?
200Mb memory consumption is not abnormal as long it does not increase even more.
I have a small patch that might fix the memory leak. I tested with Firefox in "safe mode" overnight and the memory used reached only 115 Mb. Considering that the windows are opened and closed every 7 seconds this would translate in a user activity that can span for 7-10 days.
I also ran IE6 with the patch and it seems to stay around 200Mb. I will send the patched jars (1.8.2EE P1) through the support channel. This way you can test the patch on the systems you use.
> How long have you been running the test?
I have been running the tests for about 3-4 hours. The final JS error I received is in the attachment "JS_memory_error.png"
By changing the JS engine I meant changing the version, but I already checked that I got the newest version. Sorry for the misunderstanding.
I am also aware that many others are struggling with the IE6 JS engine implementation ![]()
I am seeing now that you will provide a patch. Thanks for that, I will test asap how it behaves on our machines with our application.
Best Regards,
Harm
I have conducted a short test with the auctionMonitor and the patched jar.
However, the memory usage of IE6 increases to 500Mb on my machine. I then had to stop the test and will continue tomorrow.
Can you already provide details about the changes in the patch? What did you change exactly? Thank you.
Best Regards,
Harm
Hi again,
I have tested overnight with IE 6 and the test showed the same result as before: The used memory increases up to ~1,6 Gb and finally the JS error message already attached in "JS_memory_error.png" appears.
FYI: My exact IE6 version is 6.0.2900.5512. It's from Service Pack 3. What's yours?
Currently I am running FF 3.6 in safe mode, this test is ongoing.
Also I will run a test with IE 8.
I am running exactly the same version, 6.0.2900.5512 SP3.
The patch provided clears the bridge instance (JS object) saved in the property of the view container element, for normal pages that is the 'body' element. This property was not cleared before because the DOM document corresponding to the unloaded page would be discarded anyway. The thinking was that since the popup window is opened using window.open() call the reference might stick around thus creating a memory leak.
For now I am clueless where else the memory leak might be. I need to devise some more tests
that use JS bridge versions with certain features disabled. Hopefully that will pinpoint where the problem is. But this takes time...
I also can give some updates:
FF in safe mode consumed ~140 Mb of memory, this kept increasing until I stopped the tests.
IE8 shows better memory usage. For 2.5 hrs I had an increase from 76 to 146 Mb with a popup opened every 7 seconds. As IE8 handles every tab as extra process the processes from the individual tabs seem to be cleared in a better way. But still the main process shows increasing memory.
With this registry key
[HKEY_CURRENT_USER\Software\Microsoft\Internet Explorer\Main]
"TabShutdownDelay"=dword:00000000
it can be asserted that a process will be destroyed immediately after closing a tab, default in IE8 is 60 seconds. But this only improves the workaround a bit.
I just checked again the patched version of auctionMonitor with the tools
(1) sIEve
(2) IEJSLeaksDetector
(1) gave me no hints
(2) pointed out a leaking window object in IE6 and IE8. IE6 additionally showed a leaking BODY object (ID= document:body).
Maybe you can have a look at the application with a non-obfuscated version of ICEfaces?
The tools are for free but are not officially released, follow these links:
(1) http://www.softpedia.com/get/Programming/Other-Programming-Files/sIEve.shtml
(2) http://blogs.msdn.com/b/gpde/archive/2009/08/03/javascript-memory-leak-detector-v2.aspx
After running additional tests we discovered that just referencing icefaces-d2d.js file from a plain HTML page will trigger the memory leak. When replacing the reference with another Javascript file (prototype.js) the memory leak does not occur.
More tests need to be done now with versions of icefaces-d2d.js file that have certain parts removed. This way we can locate the code that triggers the memory leak.
Just to update what I sent via email:
Running the patch provided on monday with FF in safe mode overnight still showed a memory leak ![]()
The new example provided which opens test.html as a popup shows leaks with either of the scripts included. The difference is that the example with icefaces-d2d.js leaks more memory than the prototype.js.
I have tested this with IE6, IE8 and FF.
I will check now which parts of icefaces-d2d.js I can remove to reduce the leakage.
I have checked the example with the IE6 and the icefaces-d2d.js by commenting out certain parts.
The most "promising" part to create the leak is the part starting with "[ Ice.Community ].as(function(This)" up to the next license disclaimer.
When commenting that part out the memory seems to stay on a certain level.
I will run a longer test overnight without the mentioned part to verify.
Then I will have a detailed look at the ca. 300 lines of code.
Maybe you already have an idea when looking at that part.
I ran some more tests and now I think that the following two lines are causing the leak:
window.logger = new Ice.Log.Logger([ 'window' ]);
window.console && window.console.firebug ? new Ice.Log.FirebugLogHandler(window.logger) : new Ice.Log.WindowLogHandler(window.logger, window);
I can see that the logger is referenced in many functions but it is not checked for the existence of it.
Can I somehow disable the logger?
I am now checking how these lines can be rewritten without leaking....
Thanks Harm for your reports.
Some of test I run point to the same results you have seen. I am pretty sure now that are at least a couple of places that generate a memory leak.
Comenting out line 5261 in icefaces-d2d.js,
<< window.console && window.console.firebug ? new Ice.Log.FirebugLogHandler(window.logger) : new Ice.Log.WindowLogHandler(window.logger, window); >> will decrease the memory leak.
Commenting out also lines 4036 to 4140 in icefaces-d2d.js,
<<[ Ice.Focus = new Object ...... >> will get rid completely of the memory leak.
The explanation for these memory is simple now. Ice.Log.WindowLogHandler is registering a event handler to capture a key up event (Ctrl+Shift+T) to popup the log window that ICEfaces bridge uses. This event handler is never cleaned up. See line 1833 <<this.parentWindow.onKeyUp(function(e) { ....>>.
Also the focus retention code registers some event handlers on window load to keep track of where the focus is. Again, these handlers are not cleaned up. See lines 4129-4139 <<This.captureFocusIn = function(root) {.....>> .
Now I'm trying to add code that will cleanup these event handlers on window unload. I will create a patched icefaces.jar file and send it to you for verification.
Hi Mircea,
I have spotted also the lines with focus, the memory leak there is just not so big and I could not really verify after staring at the task manager almost the whole day ![]()
Still I am not 100% sure if these were all leaks.
I ran a test (without the lines mentioned by you) last night with FF in safe mode, which went from 54 MB to 69 MB after 4 hours. But this is below previous results.
I ran IE6 only for 1 hour, it went from 36 MB to 44 MB.
Good to see you are getting similar results!
Can't wait to have the patched icefaces.jar :-D
Still, can you send me also the unobfuscated changes as it seems that we are already using a version of ICEfaces patched by ourselves? I would need to apply the changes also there.
Best Regards,
Harm
After running countless hours the test application in search for memory leaks I believe I managed to find a few places in the code that generate memory leaks. The test I was running was just loaded a plain HTML page referencing icefaces-d2d.js file, without executing the code. I managed to eliminate the memory leaks for this use case, running the app for ~5 hours showed a modest memory usage around 45Mb.
I attached the patch that fixes these memory leaks.
Unfortunately, once I switched to using a *.iface page in the popup window I can still see a memory leak. I will need to look more into the executed code to find where the issue might be.
I will send you the patched icefaces.jar that contains the unobfuscated icefaces-d2d.js file.
| Attachment | ICE-5942_take2.patch [ 12511 ] |
Thanks for the patch.
I will test it in our application and hope it will give us already major improvements.
Will let you know about my results.
Still, I hope you can track down the other errors. If you need support from my side, please let me know.
I ran tests with the auctionMonitor example and also our application.
Unfortunately the patch did not give an improvement for our application, which opens popups with *.iface pages.
Which JS-files can I look at to check for memory leaks?
icefaces-d2d.js
ice-extras.js
Are there more to check?
Our timeline is quite tight, so I'll talk to Tyler again about a way to get additional support.
I ran the tests Tyler requested. Here are the results of the auctionMonitor example on my machine. Tests with our application are not finished, will attach them as soon as possible.
What I found interesting is that the way the popups are opened (manually via ice:commandLink or automatically via JS function) makes a difference with the patched jar. Maybe this is a hint for you?
All testcases with 20 popups, results are memory usage taken from process IEXPLORE.exe in Task Manager:
Auction Monitor IE 6 ,popups opened via manual link
(added this fragment to auctionMonitor.jspx:
<ice:commandLink id="contentVisibleAction_1" target="_blank" immediate="true"
onclick="window.open('index.jsp','secondAppWindow','status=no,resizable=no,scrollbars=no,toolbar=no,menubar=no,top=0,left=0,width=1024,height=738');">
<ice:outputText id="item_app_link"
value="Application link" />
<!-- onclick="window.open('index.jsp','secondAppWindow','status=no,resizable=no,scrollbars=no,toolbar=no,menubar=no,top=0,left=0,width=1024,height=738'); -->
</ice:commandLink>
)
Original icefaces.jar:
Start: 32,7
10: 56,8
20: 77,3
Patched icefaces.jar:
Start: 34,3
10: 38,3
20: 39,6
Auction Monitor IE 6 ,popups opened via JS timeout function
(added this fragment to auctionMonitor.jspx:
<script type="text/javascript">
setInterval(function() {
var w = window.open('index.jsp','secondAppWindow','status=no,resizable=no,scrollbars=no,toolbar=no,menubar=no,top=0,left=0,width=1024,height=738');
setTimeout(function()
, 4000);
}, 7000);
</script>
)
Original icefaces.jar:
Start: 32,4
10: 56,9
20: 78
Patched icefaces.jar:
Start: 33,9
10: 66,1
20: 91,9
Here are the results for our application (manual links only):
Original icefaces.jar:
Start: 42,1
10: 72
20: 93,4
Patched icefaces.jar:
Start: 41,8
10: 69,4
20: 90,5
So the result is slightly better, but not with a serious amount.
| Summary | Memory Leak in AuctionMonitor with 1.8.2 P01 | Memory Leak with EE 1.8.2 P01, IE6, and window.open() |
| Environment | IE 6, IE 8, FF 3.6 | IE 6 |
| Fix Version/s | 1.8.2-EE-GA_P02 [ 10226 ] | |
| Fix Version/s | 1.8.3 [ 10211 ] |
Cleaning up the window event handlers and custom properties seemed to be the solution needed to completely eradicate the memory leak. After applying this fix I don't see the constant increase in memory usage with each window open-close cycle.
Harm, I will prepare the jars for you so you can test and hopefully confirm that the leak is gone.
That sounds like good news ![]()
Can you also send me the unobfuscated changes because we use a patched version of ICEfaces and I need to apply the changes to the patch? Thanks in advance.
I have the first test results with the ICEfaces sample app, same test setup as with the previous patch:
Auction Monitor IE 6 ,popups opened via manual link
Patched icefaces.jar (2010-09-07):
Start: 33,3
10: 37,8
20: 38,9
30: 38,8
Auction Monitor IE 6 ,popups opened via JS timeout function
Patched icefaces.jar (2010-09-07):
Start: 33,6
10: 39,5
20: 38,6
30: 39,8
With the timeout function I still had a memory increase running the test for 30 minutes from 36,7 K to 57,1 K.
I will provide details about the tests with our application asap.
My first feedback would be that it looks like an improvement, but there are still leaks remaining.
With our application the results are as follows:
Patched icefaces.jar (2010-09-07):
Start: 40,7
10: 45,4
20: 48,8
I will run a longer test overnight with automatic opening and closing of the windows, because manually opening and closing the popups showed a slight increase, but the IE did a minor GC from time to time. Still, there was an increase in memory and I want to check whether there is a limit.
From the current test results it seems right now that more leaks are closed, but not all of them. Did you also run tests to check this?
I ran a long test overnight with our application (opening and closing a popup every 10 seconds) with the following result:
Start: 40,6
8:22 hrs: 136,1
So there are less leaks, but still some are left.
Our application seems to have gained more profit than the sample app.
A colleague gave me a hint to another memory analyzer which I still want to try, but maybe you made experiences with it?
http://msfast.myspace.com/
http://code.google.com/p/msfast/
The memory usage looks very reasonable to me. When minimizing the master window IE will garbage collect and the memory should go down to about 55Mb. This is pretty much the same behavior we have seen in our test that runs 'auctionMonitor' without the opening of the popup window. Browsing with IE in general will give you a similar behavior, meaning that the memory will not be entirely freed.
I will try to find out the figures of the latest successful test results so that we can compare.
There is only one leak reported by sIEve tool which points to the iframe used by ICEfaces to detect when back button is pressed. I believe this is falsely reported as leak because the number of referenced elements don't grow in time. Also, taking out the iframe does not show any change in the memory usage pattern.
I checked now also with
(1) sIEve: gave me no hints with the original icefaces.jar and both patches. So that's the same as per my comment on 10th of August
(2) IEJSLeaksDetector: Here I see leaks with the original jar and the first patch. These are gone when using the last patch. So this looks good to me now.
I will now run tests with FF and IE8 to check if the remaining leaks are because of IE6.
I have checked with the different browsers.
FF (safe mode) went from 58,2 K to 118,7 K in 3,5 hrs.
IE8 went from 35,2 K to 82,9 K in 1 hrs.
That lets me think that there are still some leaks remaining and are not only based on IE6. Can you confirm that?
This is contradicting to the output of the tools we were using.
Also, I checked this MSFast tool I mentioned and must say that it did not work at all in IE6. I think it's still in alpha status...
I don't see a memory increase with Firefox (safe mode), it just hovers around 93Mb. That being said we need to run more tests on different machines to understand better the memory usage pattern.
Which version of FF are you using, which OS?
I am using FF 3.6.9. on Windows XP Professional Service Pack 3.
I managed squeeze another improvement in IE's memory consumption. This time I changed the anonymous functions that are passed into setInterval() native function to named functions. Apparently the anonymous functions capture the window environment when created thus automatically creating a reference to the 'window' object, references that prevent IE from collecting the registered closures.
The results are as follow:
- start - 29Mb
- after 8 hours running: 111Mb
- minimizing main window: 35Mb
- after 1 hour: 45Mb
- minimizing main window: 35Mb
So, it seems that IE is behaving reasonably well. I'm not sure I can improve the memory usage anymore.
| Repository | Revision | Date | User | Message |
| ICEsoft Public SVN Repository | #22349 | Wed Sep 15 11:32:48 MDT 2010 | mircea.toma | |
| Files Changed | ||||
 MODIFY
/icefaces/trunk/icefaces/bridge/lib/window.js
MODIFY
/icefaces/trunk/icefaces/bridge/src/synchronizer.js
MODIFY
/icefaces/trunk/icefaces/bridge/lib/logger.js
MODIFY
/icefaces/trunk/icefaces/bridge/src/application.js
MODIFY
/icefaces/trunk/icefaces/bridge/src/focus.js
MODIFY
/icefaces/trunk/icefaces/bridge/lib/window.js
MODIFY
/icefaces/trunk/icefaces/bridge/src/synchronizer.js
MODIFY
/icefaces/trunk/icefaces/bridge/lib/logger.js
MODIFY
/icefaces/trunk/icefaces/bridge/src/application.js
MODIFY
/icefaces/trunk/icefaces/bridge/src/focus.js
|
| Repository | Revision | Date | User | Message |
| ICEsoft Public SVN Repository | #22350 | Wed Sep 15 11:34:40 MDT 2010 | mircea.toma | |
| Files Changed | ||||
|
MODIFY
/icefaces/trunk/icefaces/bridge/src/connection.async.js
|
Additional tests confirm the latest memory usage pattern.
This issue is considered fixed now.
| Status | Reopened [ 4 ] | Resolved [ 5 ] |
| Resolution | Fixed [ 1 ] |
I have now tested the new patch with the auction monitor sample application.
There are no recognizable differences compared to the previous version.
I also tested the scenario you mentioned with minimizing the IE window in between.
- start - 33 MB
- 4,5 hrs: 137MB
- minimizing main window: 102 MB
- 7 hrs: 170MB
- minimizing main window: 150 MB
So the memory consumption is still growing.
When opening links manually the memory consumption on my machine is reasonable. I'll wait for the results from our Citrix environment and then feedback to you.
Automated tests on Citrix environment showed no improvement, but manual tests showed that the leak is fixed. I am now doubting the test setup.
The automated opening and closing of windows via JS functions also seems to stil produce a leak, but the manual test in the ICEfaces examples show that the memory consumption is reasonable now. Therefore I also consider this issue fixed.
Thank you again!
| Status | Resolved [ 5 ] | Closed [ 6 ] |
| Assignee Priority | P1 |
I managed to reproduce IE's increasing in memory usage by using the provided jspx page. Every time a new window is opened there's an increase of ~7Mb in memory usage, once the window is closed there's about ~4Mb of memory released. So, after each window open/close cycle there's an increase in memory of ~3Mb ( = 7Mb - 4Mb).
I took the test a bit further and automated the opening and closing of windows. This way the open/close cycle was run every 7 seconds. After running the test for about 15 minutes I was seeing the memory usage reach a certain maximum threshold, on the machine I was running was 350Mb, once this threshold reach IE would release the memory aggressively to about 200Mb (very similarly to a garbage collection). From then on again the memory usage will increase gradually until reaching the threshold and going back again.
I was able to run the window ope/close cycle every 7 seconds for hours without having IE freeze or crash, every time repeating the pattern described above.
So, in conclusion I believe there is no real memory leak but just a false alarm due to IE's memory usage behavior. Actually we've seen this behavior in the past, such as for DOM updates, which prompted us to verify if really there is a memory leak by pushing IE to reach the memory threshold.