Details
-
Type:
 Bug
Bug
-
Status: Closed
-
Priority:
 Major
Major
-
Resolution: Won't Fix
-
Affects Version/s: EE-3.3.0.GA_P01, EE-3.3.0.GA_P02
-
Fix Version/s: EE-3.3.0.GA_P05
-
Component/s: ACE-Components
-
Labels:None
-
Environment:All
-
Assignee Priority:P1
-
Support Case References:Support Case #12912 - https://icesoft.my.salesforce.com/5007000000dv4q7
-
Workaround Exists:Yes
-
Workaround Description:In this specific scenario, add CartesianType.BAR before CartesianType.LINE to the list of CartesianSeries.
Description
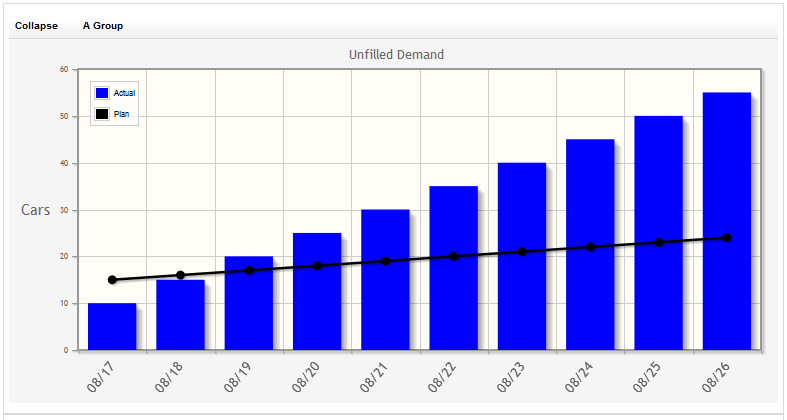
When defining a CartesianType.LINE and a CartesianType.BAR chart type to be used on the same ace:chart, the BAR data gets shifted to the right on the x axis.
When using the same chart types (BAR and BAR or LINE and LINE), this issue isn't seen.
Note: This issue seems to be related to the chart being used in a panel series component.
When using the same chart types (BAR and BAR or LINE and LINE), this issue isn't seen.
Note: This issue seems to be related to the chart being used in a panel series component.
-
Hide

-
-
META-INF/MANIFEST.MF
-
META-INF/context.xml

-
WEB-INF/classes/.../ProfileGroup.class
-
WEB-INF/.../TestRollingBarController.class
-
WEB-INF/.../TestRollingBarServlet.class
-
WEB-INF/lib/commons-beanutils.jar

-
WEB-INF/lib/commons-collections.jar
-
WEB-INF/lib/commons-digester.jar
-
WEB-INF/lib/commons-logging.jar
-
WEB-INF/lib/javax.faces.jar
-
WEB-INF/web.xml
-
index.xhtml
-
welcomeICEfaces.xhtml
-
-
-


Activity
- All
- Comments
- History
- Activity
- Remote Attachments
- Subversion
Attached test case that shows the issue. The ICEfaces jar files (ace, compat, core) need to be added into the war to run.
Steps:
- Load welcomeICEfaces.jsf
- The first BAR section should be displayed on the same x point as the line chart, which it isn't.
Show
 Arran Mccullough
added a comment - Attached test case that shows the issue. The ICEfaces jar files (ace, compat, core) need to be added into the war to run.
Steps:
Load welcomeICEfaces.jsf
The first BAR section should be displayed on the same x point as the line chart, which it isn't.
Arran Mccullough
added a comment - Attached test case that shows the issue. The ICEfaces jar files (ace, compat, core) need to be added into the war to run.
Steps:
Load welcomeICEfaces.jsf
The first BAR section should be displayed on the same x point as the line chart, which it isn't.
Marking as Won't Fix. Read the Workaround for this specific case.
This is an issue in the charts library. It doesn't have to do with our code or with anything JSF-related. It has nothing to do with the use of panel series, since it occurs outside of it as well.
I suppose this is a bug in the charts library. If the line chart is added first, it will be rendered centered within the X values. Adding another chart will render it to the right, and because the line chart is already taking most of the width due to it being centered, the bar chart appears shifted to the right. This is not an issue is the bar chart is specified before the line chart. Take a look at the screenshots lineFirstBarSecond.png (original case) and barFirstLineSecond.png (workaround).