ICEfaces
  1. ICEfaces
  2. ICE-10101

ace:chart - Mixing a LINE and BAR chart type causes the BAR chart data to shift

    Details

    • Type: Bug Bug
    • Status: Closed
    • Priority: Major Major
    • Resolution: Won't Fix
    • Affects Version/s: EE-3.3.0.GA_P01, EE-3.3.0.GA_P02
    • Fix Version/s: EE-3.3.0.GA_P05
    • Component/s: ACE-Components
    • Labels:
      None
    • Environment:
      All
    • Assignee Priority:
      P1
    • Support Case References:
    • Workaround Exists:
      Yes
    • Workaround Description:
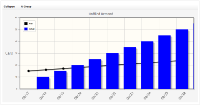
      In this specific scenario, add CartesianType.BAR before CartesianType.LINE to the list of CartesianSeries.

      Description

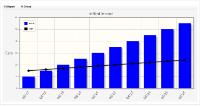
      When defining a CartesianType.LINE and a CartesianType.BAR chart type to be used on the same ace:chart, the BAR data gets shifted to the right on the x axis.

      When using the same chart types (BAR and BAR or LINE and LINE), this issue isn't seen.

      Note: This issue seems to be related to the chart being used in a panel series component.

        Activity

        Arran Mccullough created issue -
        Hide
        Arran Mccullough added a comment -

        Attached test case that shows the issue. The ICEfaces jar files (ace, compat, core) need to be added into the war to run.

        Steps:

        • Load welcomeICEfaces.jsf
        • The first BAR section should be displayed on the same x point as the line chart, which it isn't.
        Show
        Arran Mccullough added a comment - Attached test case that shows the issue. The ICEfaces jar files (ace, compat, core) need to be added into the war to run. Steps: Load welcomeICEfaces.jsf The first BAR section should be displayed on the same x point as the line chart, which it isn't.
        Arran Mccullough made changes -
        Field Original Value New Value
        Attachment Case12912Example.zip [ 17257 ]
        Attachment Case12912Example.war [ 17258 ]
        Arran Mccullough made changes -
        Description When defining a CartesianType.LINE and a CartesianType.BAR chart type to be used on the same ace:chart, the BAR data gets shifted to the right on the x axis.

        When using the same chart types (BAR and BAR or LINE and LINE), this issue isn't seen.
        When defining a CartesianType.LINE and a CartesianType.BAR chart type to be used on the same ace:chart, the BAR data gets shifted to the right on the x axis.

        When using the same chart types (BAR and BAR or LINE and LINE), this issue isn't seen.

        Note: This issue seems to be related to the chart being used in a panel series component.
        Ken Fyten made changes -
        Assignee Judy Guglielmin [ judy.guglielmin ]
        Fix Version/s EE-3.3.0.GA_P05 [ 13082 ]
        Ken Fyten made changes -
        Assignee Judy Guglielmin [ judy.guglielmin ] Arturo Zambrano [ artzambrano ]
        Assignee Priority P1 [ 10010 ]
        Arturo Zambrano made changes -
        Workaround Description In this specific scenario, add CartesianType.BAR before CartesianType.LINE to the list of CartesianSeries.
        Workaround Exists Yes [ 10007 ]
        Hide
        Arturo Zambrano added a comment - - edited

        Marking as Won't Fix. Read the Workaround for this specific case.

        This is an issue in the charts library. It doesn't have to do with our code or with anything JSF-related. It has nothing to do with the use of panel series, since it occurs outside of it as well.

        I suppose this is a bug in the charts library. If the line chart is added first, it will be rendered centered within the X values. Adding another chart will render it to the right, and because the line chart is already taking most of the width due to it being centered, the bar chart appears shifted to the right. This is not an issue is the bar chart is specified before the line chart. Take a look at the screenshots lineFirstBarSecond.png (original case) and barFirstLineSecond.png (workaround).

        Show
        Arturo Zambrano added a comment - - edited Marking as Won't Fix. Read the Workaround for this specific case. This is an issue in the charts library. It doesn't have to do with our code or with anything JSF-related. It has nothing to do with the use of panel series, since it occurs outside of it as well. I suppose this is a bug in the charts library. If the line chart is added first, it will be rendered centered within the X values. Adding another chart will render it to the right, and because the line chart is already taking most of the width due to it being centered, the bar chart appears shifted to the right. This is not an issue is the bar chart is specified before the line chart. Take a look at the screenshots lineFirstBarSecond.png (original case) and barFirstLineSecond.png (workaround).
        Arturo Zambrano made changes -
        Status Open [ 1 ] Resolved [ 5 ]
        Resolution Fixed [ 1 ]
        Arturo Zambrano made changes -
        Resolution Fixed [ 1 ]
        Status Resolved [ 5 ] Reopened [ 4 ]
        Arturo Zambrano made changes -
        Status Reopened [ 4 ] Resolved [ 5 ]
        Resolution Won't Fix [ 2 ]
        Arturo Zambrano made changes -
        Attachment lineFirstBarSecond.png [ 22583 ]
        Attachment barFirstLineSecond.png [ 22584 ]
        Ken Fyten made changes -
        Status Resolved [ 5 ] Closed [ 6 ]

          People

          • Assignee:
            Arturo Zambrano
            Reporter:
            Arran Mccullough
          • Votes:
            1 Vote for this issue
            Watchers:
            3 Start watching this issue

            Dates

            • Created:
              Updated:
              Resolved: