Details
-
Type:
 Improvement
-
Status: Closed
-
Priority:
 Major
Major
-
Resolution: Fixed
-
Affects Version/s: 5.1
-
Fix Version/s: 5.1.1
-
Component/s: Core/Parsing
-
Labels:None
-
Environment:-d64
-XX:+UseConcMarkSweepGC
-XX:+CMSClassUnloadingEnabled
-XX:+HeapDumpOnOutOfMemoryError
-XX:MaxPermSize=256m
-Xms256m
-Xmx1024m
-XX:PermSize=256M
-Dfile.encoding=UTF-8
Description
5.1 had improvements in the rendering time of images but it in the provided sample a client is still running into memory issue during a page capture.
Activity
| Field | Original Value | New Value |
|---|---|---|
| Fix Version/s | 5.1.1 [ 11770 ] |
| Attachment | cache_changes.png [ 17391 ] |
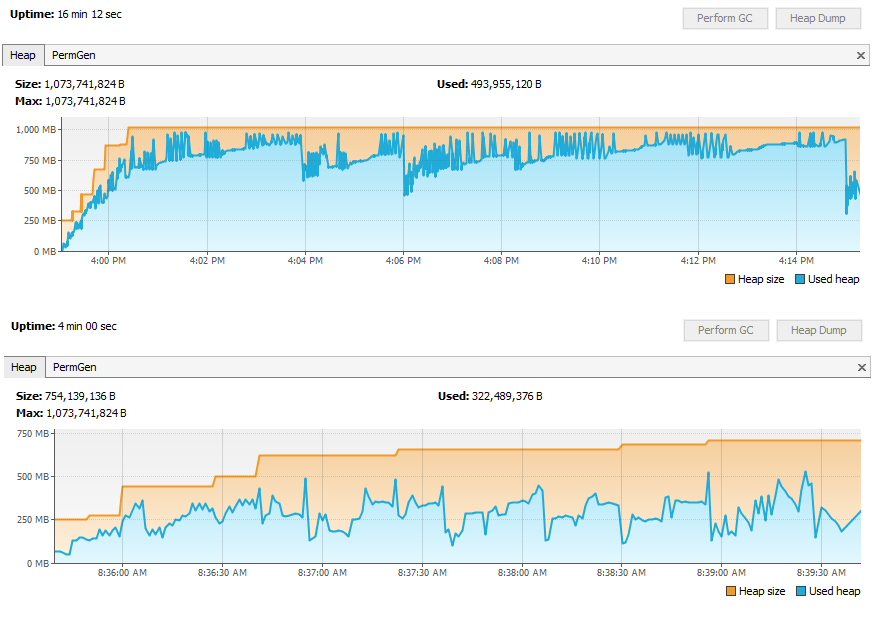
After doing some profiling it was clear that the ImagePool and inline image cache were holding on to too many image objects. And as a result the garbage collection times went up significantly as the capture proceeded. I refactored the ImagePool and inline image cache to use a WeakHashMap. The results where quite significant, render time dropped from 16 to 4 minutes. And the maxed used heap dropped from 1038MB to 559MB. The attached graphs are worth 1000 works as they show the before and after heap profile of the capture.
Show
 Patrick Corless
added a comment - After doing some profiling it was clear that the ImagePool and inline image cache were holding on to too many image objects. And as a result the garbage collection times went up significantly as the capture proceeded. I refactored the ImagePool and inline image cache to use a WeakHashMap. The results where quite significant, render time dropped from 16 to 4 minutes. And the maxed used heap dropped from 1038MB to 559MB. The attached graphs are worth 1000 works as they show the before and after heap profile of the capture.
Patrick Corless
added a comment - After doing some profiling it was clear that the ImagePool and inline image cache were holding on to too many image objects. And as a result the garbage collection times went up significantly as the capture proceeded. I refactored the ImagePool and inline image cache to use a WeakHashMap. The results where quite significant, render time dropped from 16 to 4 minutes. And the maxed used heap dropped from 1038MB to 559MB. The attached graphs are worth 1000 works as they show the before and after heap profile of the capture.
I have a little more testing to do but so far really happy with the results. Marking as fixed.
Show
Patrick Corless
added a comment - I have a little more testing to do but so far really happy with the results. Marking as fixed.
| Status | Open [ 1 ] | Resolved [ 5 ] |
| Resolution | Fixed [ 1 ] |
| Status | Resolved [ 5 ] | Closed [ 6 ] |
Top image is heap for an 18 page run, button image is the same run but after the cache changes.