Details
-
Type:
 Bug
Bug
-
Status: Closed
-
Priority:
 Major
Major
-
Resolution: Fixed
-
Affects Version/s: 3.1.0.RC1
-
Fix Version/s: 3.2
-
Component/s: Sample Apps
-
Labels:None
-
Environment:Icefaces 3 from trunk, revision 29857 / apache-tomcat-7.0.29 / jdk1.6.0_33
-
Assignee Priority:P1
Description
Activity
- All
- Comments
- History
- Activity
- Remote Attachments
- Subversion
I've tested the scenarios described in the description with latest icefaces3/trunk, rvn#30887 and see no issues with the compat/component-showcase ice:dataTable demo.
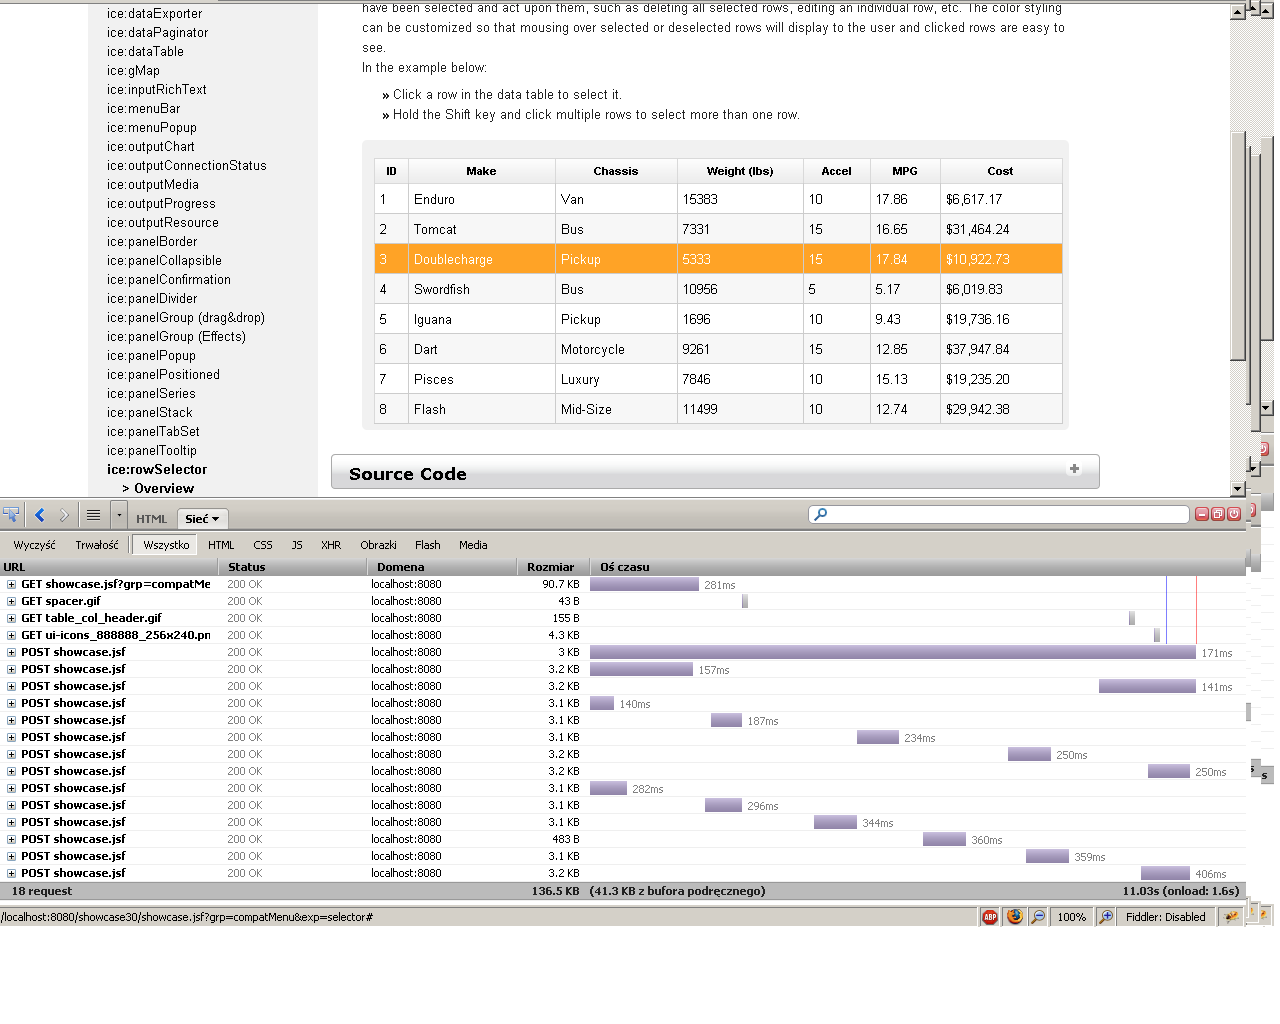
However, using the showcase demo w/ Tomcat and FF I do see fairly slow performance when using the row selector demo. Also, clicking through many subsequent selections does result in continually increasing response times.
This needs priority evaluation.
Original Reported Description:
Tomcat tested with three apps:
- component-showcase with current Icefaces 1.8.3 from trunk
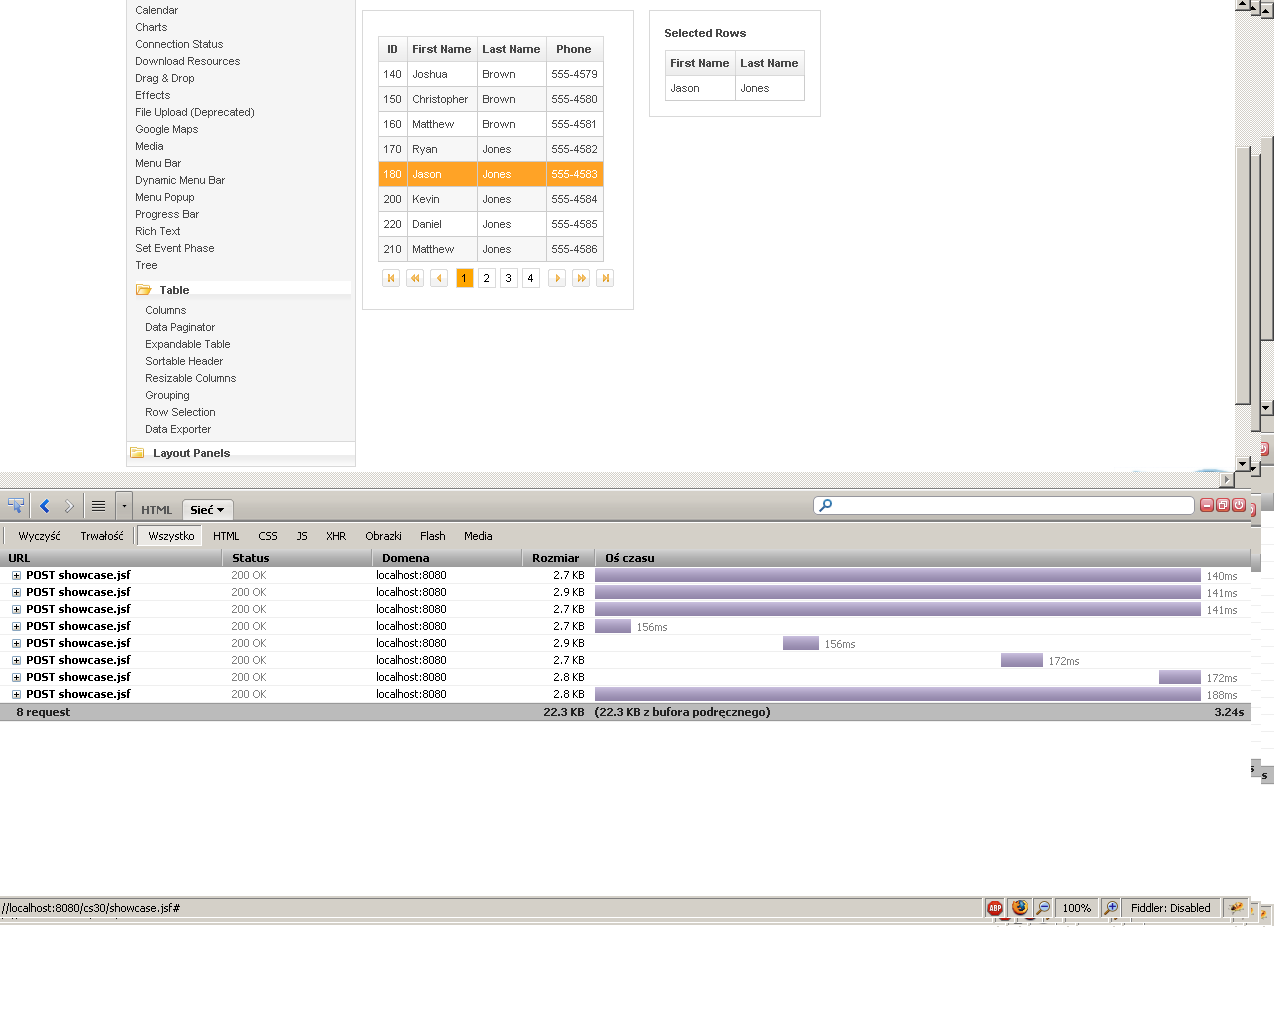
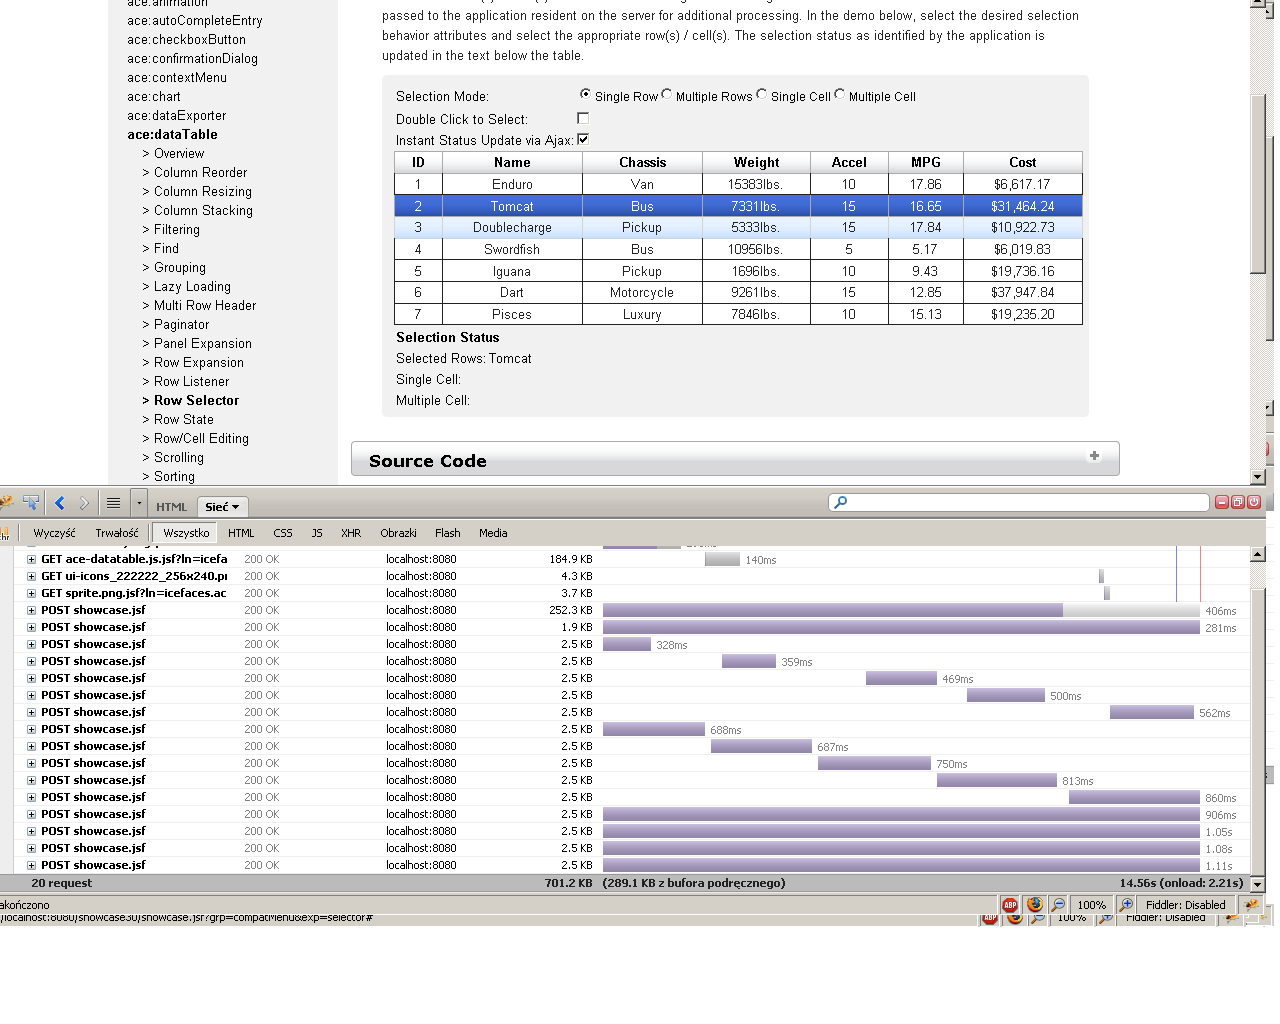
- component-showcase with current Icefaces 3.1.0-RC1 from trunk
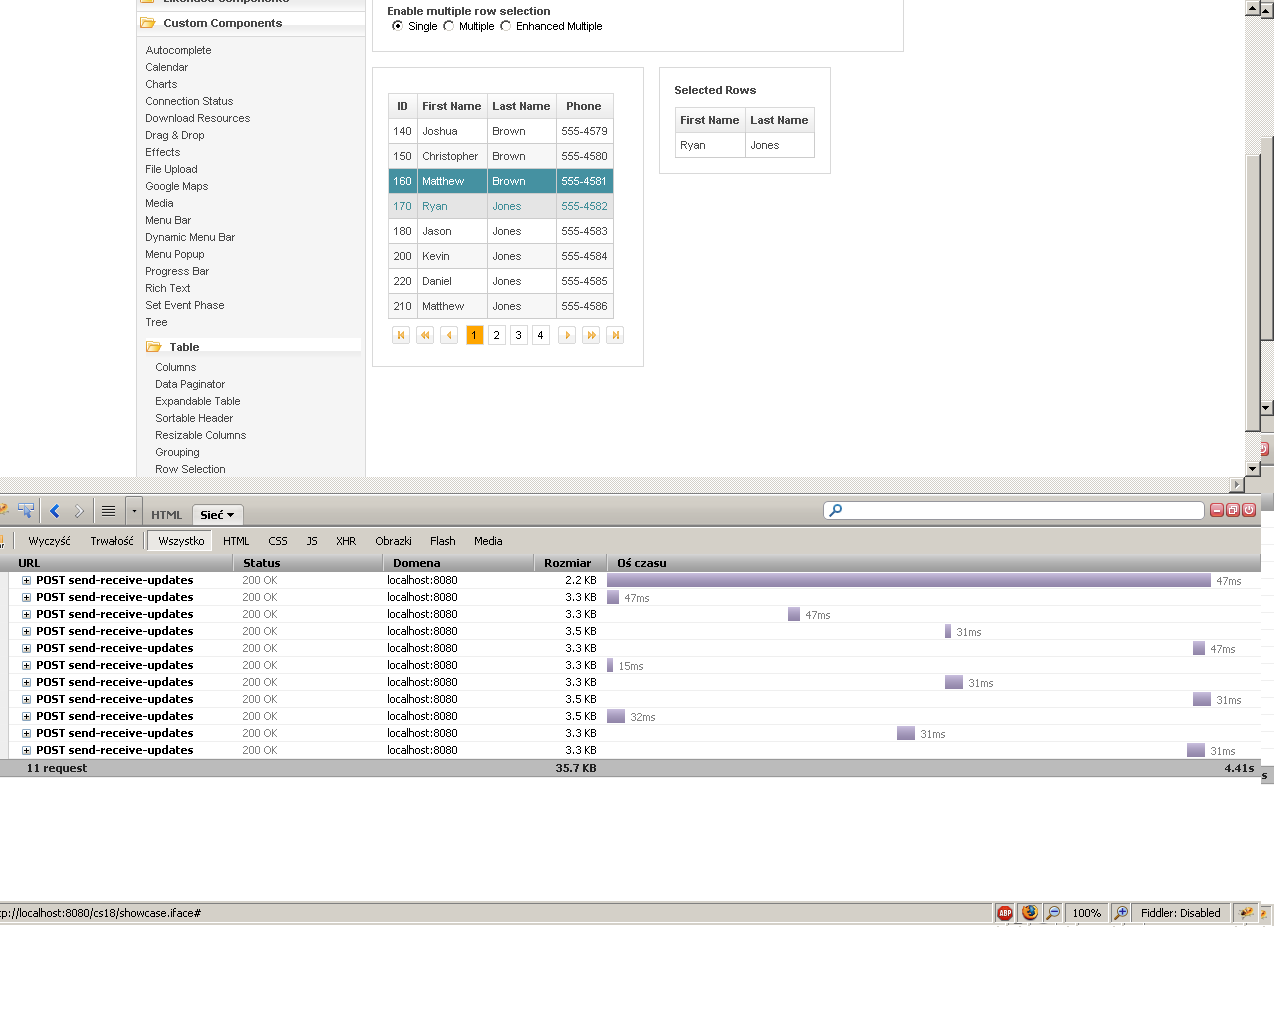
- showcase with current Icefaces 3.1.0-RC1 from trunk
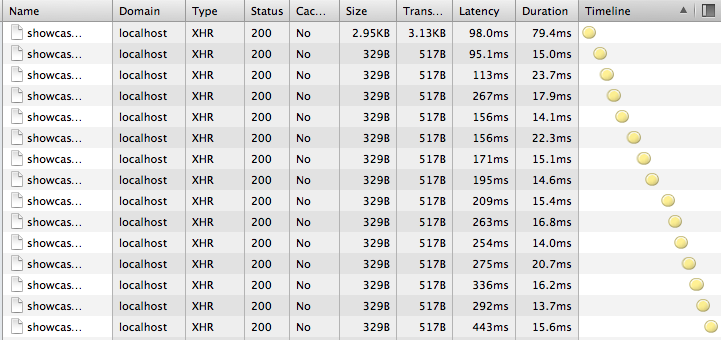
In datatable / row selector view from Ice 1.8.3 switching between rows seems to 4-10 time faster than the same in Ice 3.0 ?!
Additionaliy each next request is slower, and slower ...visualvm doesn't show any memory leak or processor overhead.
Firebug screens attached.
was:
Tomcat tested with three apps:
- component-showcase with current Icefaces 1.8.3 from trunk
- component-showcase with current Icefaces 3.1.0-RC1 from trunk
- showcase with current Icefaces 3.1.0-RC1 from trunk
In datatable / row selector view from Ice 1.8.3 switching between rows seems to 4-10 time faster than the same in Ice 3.0 ?!
Additionaliy each next request is slower, and slower ...visualvm doesn't show any memory leak or processor overhead.
Firebug screens attached.
Clearly some server side process is growing noticeably with each request. This is consistent with the reporters claim that there was no growing client processor overhead or memory leak.
Perhaps it is some odd app level leak in showcase?
Assigning to Mircea for investigation as per Kens request.
Out of curiosity I've confirmed that this effects the ice:DataTable as well. This appears to be application specific or ICEfaces wide.
I am attaching profiling output for a series of requests made via the ace:confirmationPanel.
As you can see a slow increase to the average latency of a request is taking place. This is common to all the components/features I've reviewed on showcase. There appears to be a larger increase for the more complicated components.
Confirmed that showcase checkbox demo increases by 10 ms for each click. Response from the server does not change. Also, auction demo shows no such symptoms.
Note that this issue does not affect the 3.1 or EE 3.0.0.GA_P01 official releases as they both ship with Mojarra JSF 2.1.6, which doesn't exhibit the issue.
org.icefaces.autoid setting does not affect the ADD/REMOVE accumulation in basic.
Could we make MandatoryResourcesSetup initially add the components in the sequence that ResourceOrdering prefers, so that we won't be moving them later?
It looks like Mojarra 2.1.3 has a similar behaviour where the component tree grows continually with each AJAX postpack due to re-arranging of the resources done by MandatoryResourceSetup and ResourceOrdering system event listeners.
The fix that works both for 2.1.3 and >2.1.10 is to mark the parents of re-ordered components as not in view, avoiding thus the firing of component addition or removal. The result is that JSF state saving will not react (by trying to restore component addition or removal) to the modifications done by our system event listeners.
Re-opening the case. As reported in ICE-8717, yesterday's changes related to this case (r31825 and r31833) are now causing the following exception when running the component-showcase example:
java.lang.NullPointerException
at com.sun.faces.application.view.StateManagementStrategyImpl$4.visit(StateManagementStrategyImpl.java:331)
at com.sun.faces.component.visit.FullVisitContext.invokeVisitCallback(FullVisitContext.java:151)
at javax.faces.component.UIComponent.visitTree(UIComponent.java:1590)
at javax.faces.component.UIComponent.visitTree(UIComponent.java:1601)
at com.sun.faces.application.view.StateManagementStrategyImpl.restoreView(StateManagementStrategyImpl.java:326)
at com.sun.faces.application.StateManagerImpl.restoreView(StateManagerImpl.java:188)
at com.sun.faces.application.view.ViewHandlingStrategy.restoreView(ViewHandlingStrategy.java:123)
at com.sun.faces.application.view.FaceletViewHandlingStrategy.restoreView(FaceletViewHandlingStrategy.java:453)
at com.sun.faces.application.view.MultiViewHandler.restoreView(MultiViewHandler.java:148)
at com.sun.faces.lifecycle.RestoreViewPhase.execute(RestoreViewPhase.java:192)
at com.sun.faces.lifecycle.Phase.doPhase(Phase.java:101)
at com.sun.faces.lifecycle.RestoreViewPhase.doPhase(RestoreViewPhase.java:116)
at com.sun.faces.lifecycle.LifecycleImpl.execute(LifecycleImpl.java:118)
at javax.faces.webapp.FacesServlet.service(FacesServlet.java:593)
at org.apache.catalina.core.ApplicationFilterChain.internalDoFilter(ApplicationFilterChain.java:305)
at org.apache.catalina.core.ApplicationFilterChain.doFilter(ApplicationFilterChain.java:210)
at org.apache.catalina.core.StandardWrapperValve.invoke(StandardWrapperValve.java:225)
at org.apache.catalina.core.StandardContextValve.invoke(StandardContextValve.java:123)
at org.apache.catalina.authenticator.AuthenticatorBase.invoke(AuthenticatorBase.java:472)
at org.apache.catalina.core.StandardHostValve.invoke(StandardHostValve.java:168)
at org.apache.catalina.valves.ErrorReportValve.invoke(ErrorReportValve.java:98)
at org.apache.catalina.valves.AccessLogValve.invoke(AccessLogValve.java:927)
at org.apache.catalina.core.StandardEngineValve.invoke(StandardEngineValve.java:118)
at org.apache.catalina.connector.CoyoteAdapter.service(CoyoteAdapter.java:407)
at org.apache.coyote.http11.AbstractHttp11Processor.process(AbstractHttp11Processor.java:1001)
at org.apache.coyote.AbstractProtocol$AbstractConnectionHandler.process(AbstractProtocol.java:585)
at org.apache.tomcat.util.net.JIoEndpoint$SocketProcessor.run(JIoEndpoint.java:312)
at java.util.concurrent.ThreadPoolExecutor$Worker.runTask(ThreadPoolExecutor.java:886)
at java.util.concurrent.ThreadPoolExecutor$Worker.run(ThreadPoolExecutor.java:908)
at java.lang.Thread.run(Thread.java:680)
I verified these changes as the cause by reverting them and re-running the component-showcase example.
There doesn't seem to be a problem with showcase app, either in the ACE or ICE sections. Using the debugger, I can see that the code that is throwing the NPE is never hit when running the current showcase - only when running component-showcase:
                Object restoredAddList[] = (Object[]) state.get(CLIENTIDS_TO_ADD_NAME);
                if (restoredAddList != null && restoredAddList.length > 0) {
                    // Restore the list of added components
                    List<ComponentStruct> addList = new ArrayList<ComponentStruct>
...
(restoredAddList.length);
As it's trying to restore the list of added components, it looks like the one or more of the state entries is "corrupted" or at least in a format that the code doesn't like.
I've tested the scenarios described in the description with latest icefaces3/trunk, rvn#30887 and see no issues with the compat/component-showcase ice:dataTable demo.
However, using the showcase demo w/ Tomcat and FF I do see fairly slow performance when using the row selector demo. Also, clicking through many subsequent selections does result in continually increasing response times.
This needs priority evaluation.
Screens with problem