Details
-
Type:
 Bug
Bug
-
Status: Closed
-
Priority:
 Major
Major
-
Resolution: Invalid
-
Affects Version/s: 3.1.0.BETA1
-
Fix Version/s: 3.1.0.BETA2, 3.1
-
Component/s: QA
-
Labels:None
-
Environment:HideICEfaces3/trunk rev. 29194
Server: Tomcat6
Browsers: Chrome19 (& IE8 with Chrome Frame)
QA test location in SVN: http://server.ice:8888/svn/repo/qa/trunk/Regression-Icefaces2/ICE-2619ShowICEfaces3/trunk rev. 29194 Server: Tomcat6 Browsers: Chrome19 (& IE8 with Chrome Frame) QA test location in SVN: http://server.ice:8888/svn/repo/qa/trunk/Regression-Icefaces2/ICE-2619
Description
The initial version of this test has been modified to consecutively load a page with a large dataTable and then navigate to an empty page, this iteration taking place for 250 times. This test has been automated and can be run in Test Runner using the next steps:
- build the test application war file (
- deploy
- build the selenium.war file (containing the selenium core files), and deploy to tomcat. For this test the pre-built selenium.war file is attached to this JIRA.
- load in Chrome the URL: http://localhost:8080/selenium/core/TestRunner.html ; then click on the 'Go' button that will load the test case in testRunner.
- open Task Manager and write down the memory usage of all the Chrome processes.
- start the test suite by clicking in testRunner on the 'Run all tests' button.
- at the end of the tests, write down again the memory usage of the Chrome processes, and continue watching the memory levels to see if they keep accumulating.
Here are my results:
1) Chrome19 tests:
Start time: 10:44AM
Chrome processes (total memory usage): 91,000K
End time: 10:52AM
Chrome processes (total memory usage): 787,000K
After the completion of the test there is a decrease of memory usage to ~ 720,600K, then a constant increase of ~4K/sec that occurs as long as the browser is open.
2) IE8 with Chrome Frame tests:
Start time: 11:00AM
Chrome processes:
27,000K
25,000K
IE processes:
22,444K
17,256K
End time: 11:04AM
Chrome processes:
34,404K
723,484K
When the test ends, the Chrome memory usage decreases immediately by ~300K, and then starts increasing again by ~4K/sec; this increase does not appear to stop unless the browser is closed.
IE processes:
23,584K
17,316K
No increase of IE memory usage after the completion of the test.
-
Hide
- selenium.war
- 286 kB
- Carmen Cristurean
-
- META-INF/MANIFEST.MF 0.1 kB
- core/Blank.html 0.1 kB
- core/icons/all.png 0.6 kB
- core/icons/continue.png 0.4 kB
- core/icons/continue_disabled.png 0.4 kB
- core/icons/pause.png 0.3 kB
- core/icons/pause_disabled.png 0.3 kB
- core/icons/selected.png 0.7 kB
- core/icons/step.png 0.4 kB
- core/icons/step_disabled.png 0.4 kB
- core/iedoc-core.xml 64 kB
- core/iedoc.xml 67 kB
- core/InjectedRemoteRunner.html 0.2 kB
- core/lib/cssQuery/cssQuery-p.js 6 kB
- core/lib/cssQuery/src/cssQuery-level2.js 5 kB
- core/lib/cssQuery/src/cssQuery-level3.js 4 kB
- core/lib/.../src/cssQuery-standard.js 2 kB
- core/lib/cssQuery/src/cssQuery.js 12 kB
- core/lib/prototype.js 54 kB
- core/lib/scriptaculous/builder.js 3 kB
- core/lib/scriptaculous/controls.js 27 kB
- core/lib/scriptaculous/dragdrop.js 29 kB
- core/lib/scriptaculous/effects.js 32 kB
- core/lib/scriptaculous/scriptaculous.js 2 kB
- core/lib/scriptaculous/slider.js 11 kB
- core/lib/scriptaculous/unittest.js 13 kB
- core/lib/snapsie.js 3 kB
- core/RemoteRunner.html 4 kB
- core/scripts/find_matching_child.js 2 kB
- core/scripts/htmlutils.js 51 kB
Activity
- All
- Comments
- History
- Activity
- Remote Attachments
- Subversion
Chrome 19 on Mac doesn't show any signs of leaking memory. On the other hand In Windows the memory leak is present.
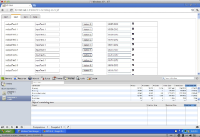
Running the test in Selenium shows clearly that there's is a memory leak. The first screenshot shows how the heap is used after just 10 iteration. The first heap snapshot taken with the tools integrated in Chrome shows a memory usage of 9.11Mb, this snapshot was taken only after 2 iterations.
After another 8 iterations another snapshot was taken, this time the memory usage jumped to 24.5Mb. Using the comparison
view we can see the number and the type of additional objects (the delta) kept in the heap. Sorting by the 'Size delta' column we can see that the bulk of the data taking up heap space is Chrome's internal code, compiled code and the non-DOM arrays.
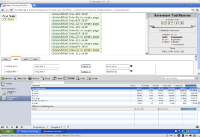
Running the test without Selenium shows a different pattern for the memory usage. The second screenshot shows the first heap snapshot taken after 2 iterations (just like in the first test) using only 4.87Mb. Then after 8 manually driven iterations the second heap snapshot was taken. This time the memory usage barely changed compared to the first snapshot, having it at 4.98Mb. Taking snapshots after more iterations shows that the memory stays around the 4.90Mb value which clearly indicates that this small variations can be attributed to the garbage collection.
In conclusion, running the test without the Selenium tool shows that the data table does not cause a memory leak.


Very similar results when executing this test with ICEfaces 3.0.1 release code in Chrome19:
Start time: 3:57 PM
Chrome processes:
31,096K
15,108K
5,176K
39,300K
End time: 4:06 PM
Chrome processes:
701,672K
15,112K
5,184K
47,184K
There is also an increase in memory usage after completing the test (~12K/sec).