Details
Description
RIM has reported memory leaks in their application. Their testing consists of using JMeter scripts to load the application by essentially doing the following:
- Create a new View
- interact with the application
- Dispose of the View, hopefully releasing resources
- Repeat.
They are testing against version 1.6.2, which has a great deal of relevance, but version 1.7 Beta 1 and 1.6.2 have some similarities too.
I've tried testing timezone3 with concurrent DOM views, using JMeter and have a few observations.
1) There does appear to be a memory leak as long as the session sticks around in 1.6.2. In their application, and they see people using multiple views for extended periods of time.
2) The timezone demonstration applications have not kept up with best practices and have not been updated in the Concurrent DOM Views world. They flat out do the wrong thing.
3) There's a potentially disastrous problem in our JSF usage or implementation in that several "application" scoped beans can be created the first time the application starts up, and this is particularly noticeable when using JMeter.
4) Threads and their ThreadLocal variables. There appear to be some paths through the servlet hierarchy and perhaps the RenderManager structure that allow threads to keep their ThreadLocal references after the threads have passed. While these aren't necessarily leaks in the normal sense in that the references should be replaced later with other references, it looks like some threads can get sidelined for periods of time holding references that look like leaks. See 2 and 3.
5) Race conditions in rendering with multiple Views open?
1) The 1.6.2 code keeps a bunch of DOMContext objects keyed by view name in the Session record. If there is a rendering exception in the TimezoneBean, it disposes of itself somewhat permanently, and removes itself from the renderGroup only, but does not clean up the Session. It does not remove the DOMContext bundle from the Session, and these DOMContext objects contain references to all the heavies. All 1.6.2 example applications MUST call BridgeFacesContext.dispose() in addition to all other timer related activities.
Fine, you say. How often do we get a renderingException callback in Timezone3? Well, actually, when there are several views open, it happens a lot in conjunction with the RejectionHandler being executed as shown in the following stack dump, and this happens several times in succession.
27-Feb-2008 4:53:23 PM com.icesoft.faces.async.render.RejectionHandler rejectedExecution
WARNING: render task was rejected: com.icesoft.faces.async.render.RunnableRender@1c836e8
27-Feb-2008 4:53:28 PM com.icesoft.faces.webapp.parser.Parser parse
SEVERE: Failed to execute JSP lifecycle.
javax.servlet.jsp.JspException
at com.sun.faces.taglib.jsf_core.ViewTag.doEndTag(ViewTag.java:235)
at com.icesoft.faces.webapp.parser.Parser.executeJspLifecycle(Parser.java:203)
at com.icesoft.faces.webapp.parser.Parser.parse(Parser.java:134)
at com.icesoft.faces.application.D2DViewHandler.renderResponse(D2DViewHandler.java:543)
at com.icesoft.faces.application.D2DViewHandler.renderView(D2DViewHandler.java:153)
at com.sun.faces.lifecycle.RenderResponsePhase.execute(RenderResponsePhase.java:107)
at com.sun.faces.lifecycle.LifecycleImpl.phase(LifecycleImpl.java:268)
at com.sun.faces.lifecycle.LifecycleImpl.render(LifecycleImpl.java:137)
at com.icesoft.faces.webapp.http.core.PageServer$1.respond(PageServer.java:26)
at com.icesoft.faces.webapp.http.servlet.ServletRequestResponse.respondWith(ServletRequestResponse.java:150)
This appears to be the major memory leak. This isn't as big a deal in the Head, because the entire DOMContext bundle is not used at all in the same way. There's no view specific information kept in the session record.
#2) Clean up TimezoneBean. This gets really confusing. The TimezoneBean is in JSF request scope, except ICEfaces co-opts this, and the TimezoneBeans are essentially session scope beans since they don't normally go away until the session expires, unless the browser or JMeter sends dispose-views. At this stage, the TimezoneBean should never ever call requestStop and clock.dispose(). If it does, the clock stops for all other concurrent views, and the IntervalRenderer supporting this group of Views is also disposed. Note that if any of these renderThreads hold a ThreadLocal to a PersistentFacesState object, it will be held as long as the IntervalRenderer is stopped. This isn't a memory leak because it is possible to flush out all the references, it's just a bit of a sidetrack. Stopping the clock though is bad. If you could determine that you were the last bean in the RenderGroup, maybe you could stop it, but it's best to just leave it running at the moment.
protected boolean performCleanup() {
state = null;
try {
if (clock != null) {
// clock.requestStop();
clock.remove(this);
// clock.dispose();
clock = null;
}
return true;
} catch (Exception failedCleanup) {
System.out.println("Yup exception. " + failedCleanup);
failedCleanup.printStackTrace();
}
return false;
}
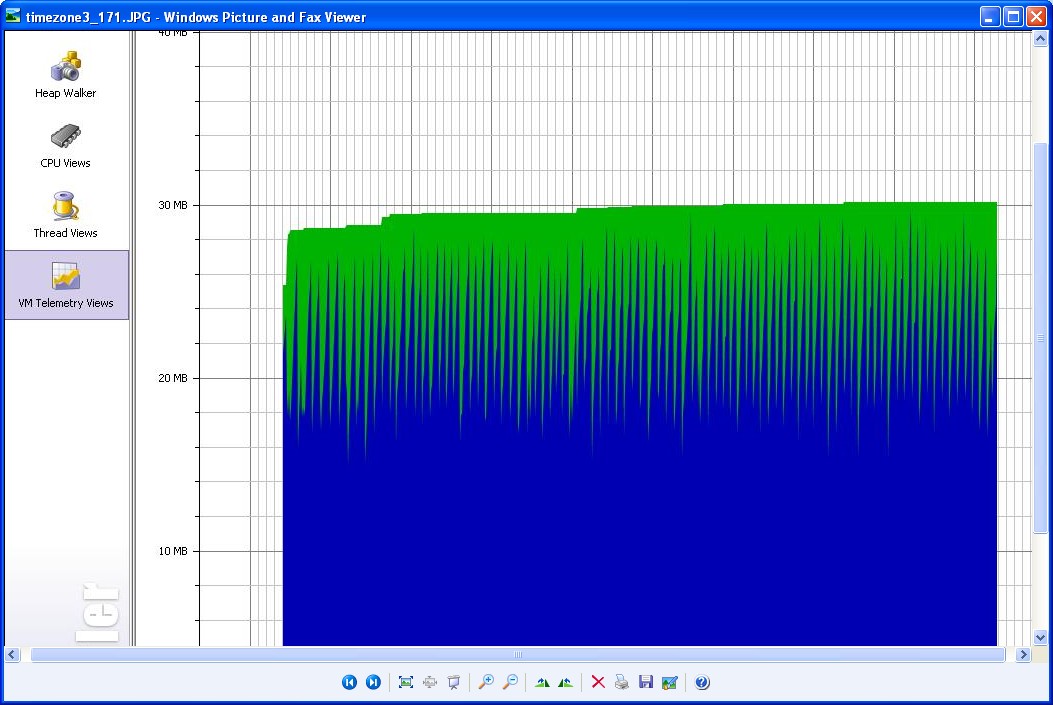
#3) Here's a log trace of Timezone 3 using the Head and JMeter with 10 clients starting over 10 seconds. It's not too bad, we only get 4 RenderManager instances. In 1.6.2 I'd get 7 or 8 because it takes forever to instantiate the RenderManager. So that's a bad race condition. Ted says that this is likely our meddling with things, but I don't know any details. Over time, 3 of these RenderManager instances and the associated RenderHubs are GC'd. BUT Not the RenderThreads. They persist for the lifetime of the application. So one RenderHub wins, and its' threads are the ones that are used, but in this case, the other (3 * 15 = 45 ) Threads persist until the server is shut down. If they ever executed a RunnableRender, then they have a ThreadLocal reference that is never released.
class: javax/servlet/Servlet.class
29-Feb-2008 3:20:42 PM com.icesoft.faces.application.D2DViewHandler <clinit>
INFO:
ICEsoft Technologies, Inc.
ICEfaces x.x.x
Build number: x
Revision: x
29-Feb-2008 3:20:43 PM org.apache.coyote.http11.Http11BaseProtocol start
INFO: Starting Coyote HTTP/1.1 on http-8080
29-Feb-2008 3:20:44 PM org.apache.jk.common.ChannelSocket init
INFO: JK: ajp13 listening on /0.0.0.0:8009
29-Feb-2008 3:20:44 PM org.apache.jk.server.JkMain start
INFO: Jk running ID=0 time=0/31 config=null
29-Feb-2008 3:20:44 PM org.apache.catalina.storeconfig.StoreLoader load
INFO: Find registry server-registry.xml at classpath resource
29-Feb-2008 3:20:44 PM org.apache.catalina.startup.Catalina start
INFO: Server startup in 5047 ms
29-Feb-2008 3:20:55 PM com.icesoft.faces.async.render.RenderHub createScheduledService
INFO: scheduled render service created:
core pool size : 5
29-Feb-2008 3:20:55 PM com.icesoft.faces.async.render.RenderHub createScheduledService
INFO: scheduled render service created:
core pool size : 5
29-Feb-2008 3:20:55 PM com.icesoft.faces.async.render.RenderHub createScheduledService
INFO: scheduled render service created:
core pool size : 5
29-Feb-2008 3:20:55 PM com.icesoft.faces.async.render.RenderHub createScheduledService
INFO: scheduled render service created:
core pool size : 5
29-Feb-2008 3:20:56 PM com.icesoft.faces.async.render.RenderHub createCoreService
INFO: core render service created:
core pool size : 10
max pool size : 15
keep alive time: 300000
29-Feb-2008 3:20:56 PM com.icesoft.faces.async.render.RenderHub createCoreService
INFO: core render service created:
core pool size : 10
max pool size : 15
keep alive time: 300000
29-Feb-2008 3:20:56 PM com.icesoft.faces.async.render.RenderHub createCoreService
INFO: core render service created:
core pool size : 10
max pool size : 15
keep alive time: 300000
29-Feb-2008 3:20:56 PM com.icesoft.faces.async.render.RenderHub createCoreService
INFO: core render service created:
core pool size : 10
max pool size : 15
keep alive time: 300000
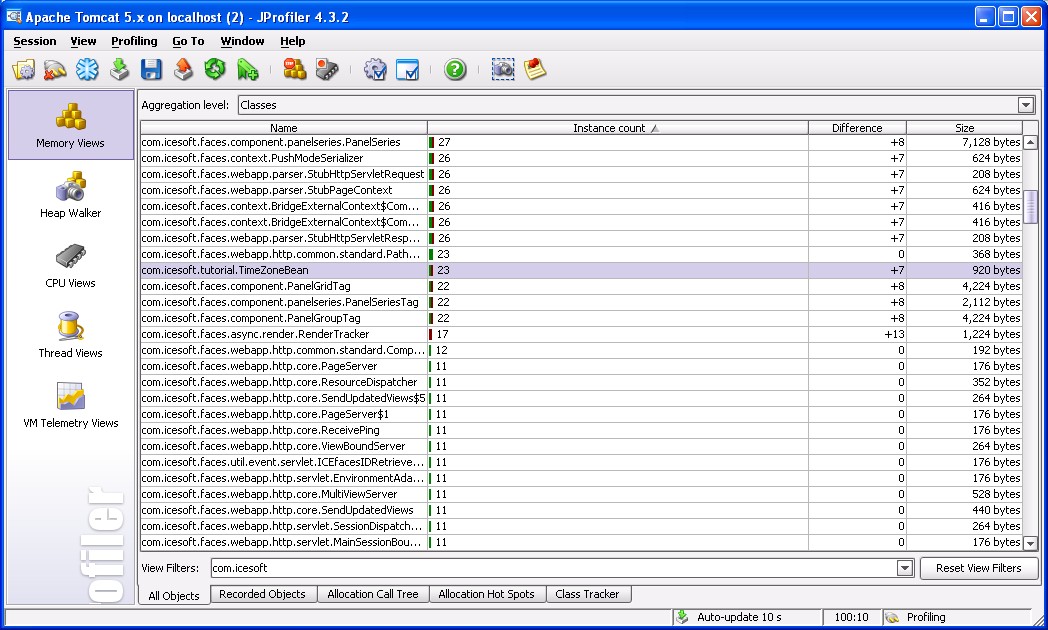
#4) Every time I see an accumulation of objects, the culprit is instances of PersistentFacesState being kept around in ThreadLocal references. JPRofiler doesn't let me find which threads are holding them, and all the ThreadLocals should be reused, over time. I have seen a large number of really odd ThreadLocal references though. From Catalina.shutdownHook objects to logFlushers, each with a ThreadLocal reference to PersistentFacesState. These too, I think go away over time, and it's just the nature of the JProfiler snapshot that catches them, I think.
We've put in disposing of the ThreadLocal references in RunnableRender after the lifecycle is executed and it has reduced the ThreadLocal reference to PFState from 15 to 1, but always, it seems, 1 remains. I'm not sure where that's being held. I think too, it is possible for HTTP threads to obtain ThreadLocal references and for the threads to skip their clearing code if rendering exceptions occur (which we've seen in 1). THere's no guarantee how often HTTP threads are going to be used, so it's possible for a Thread to sit idle for 'some time' during which the PFState object is held in memory.
Again, all of the references in 4 'should' be flushed over time and aren't necessarily pure evil. Just a distraction.
Ted mentioned asserting that the ThreadLocals on entry and exit of the MainServlet service methods and the RunnableRender methods are null, and catching them this way. This will have to be done with introspection though, as all the methods in the ThreadLocalMap are private.
- Create a new View
- interact with the application
- Dispose of the View, hopefully releasing resources
- Repeat.
They are testing against version 1.6.2, which has a great deal of relevance, but version 1.7 Beta 1 and 1.6.2 have some similarities too.
I've tried testing timezone3 with concurrent DOM views, using JMeter and have a few observations.
1) There does appear to be a memory leak as long as the session sticks around in 1.6.2. In their application, and they see people using multiple views for extended periods of time.
2) The timezone demonstration applications have not kept up with best practices and have not been updated in the Concurrent DOM Views world. They flat out do the wrong thing.
3) There's a potentially disastrous problem in our JSF usage or implementation in that several "application" scoped beans can be created the first time the application starts up, and this is particularly noticeable when using JMeter.
4) Threads and their ThreadLocal variables. There appear to be some paths through the servlet hierarchy and perhaps the RenderManager structure that allow threads to keep their ThreadLocal references after the threads have passed. While these aren't necessarily leaks in the normal sense in that the references should be replaced later with other references, it looks like some threads can get sidelined for periods of time holding references that look like leaks. See 2 and 3.
5) Race conditions in rendering with multiple Views open?
1) The 1.6.2 code keeps a bunch of DOMContext objects keyed by view name in the Session record. If there is a rendering exception in the TimezoneBean, it disposes of itself somewhat permanently, and removes itself from the renderGroup only, but does not clean up the Session. It does not remove the DOMContext bundle from the Session, and these DOMContext objects contain references to all the heavies. All 1.6.2 example applications MUST call BridgeFacesContext.dispose() in addition to all other timer related activities.
Fine, you say. How often do we get a renderingException callback in Timezone3? Well, actually, when there are several views open, it happens a lot in conjunction with the RejectionHandler being executed as shown in the following stack dump, and this happens several times in succession.
27-Feb-2008 4:53:23 PM com.icesoft.faces.async.render.RejectionHandler rejectedExecution
WARNING: render task was rejected: com.icesoft.faces.async.render.RunnableRender@1c836e8
27-Feb-2008 4:53:28 PM com.icesoft.faces.webapp.parser.Parser parse
SEVERE: Failed to execute JSP lifecycle.
javax.servlet.jsp.JspException
at com.sun.faces.taglib.jsf_core.ViewTag.doEndTag(ViewTag.java:235)
at com.icesoft.faces.webapp.parser.Parser.executeJspLifecycle(Parser.java:203)
at com.icesoft.faces.webapp.parser.Parser.parse(Parser.java:134)
at com.icesoft.faces.application.D2DViewHandler.renderResponse(D2DViewHandler.java:543)
at com.icesoft.faces.application.D2DViewHandler.renderView(D2DViewHandler.java:153)
at com.sun.faces.lifecycle.RenderResponsePhase.execute(RenderResponsePhase.java:107)
at com.sun.faces.lifecycle.LifecycleImpl.phase(LifecycleImpl.java:268)
at com.sun.faces.lifecycle.LifecycleImpl.render(LifecycleImpl.java:137)
at com.icesoft.faces.webapp.http.core.PageServer$1.respond(PageServer.java:26)
at com.icesoft.faces.webapp.http.servlet.ServletRequestResponse.respondWith(ServletRequestResponse.java:150)
This appears to be the major memory leak. This isn't as big a deal in the Head, because the entire DOMContext bundle is not used at all in the same way. There's no view specific information kept in the session record.
#2) Clean up TimezoneBean. This gets really confusing. The TimezoneBean is in JSF request scope, except ICEfaces co-opts this, and the TimezoneBeans are essentially session scope beans since they don't normally go away until the session expires, unless the browser or JMeter sends dispose-views. At this stage, the TimezoneBean should never ever call requestStop and clock.dispose(). If it does, the clock stops for all other concurrent views, and the IntervalRenderer supporting this group of Views is also disposed. Note that if any of these renderThreads hold a ThreadLocal to a PersistentFacesState object, it will be held as long as the IntervalRenderer is stopped. This isn't a memory leak because it is possible to flush out all the references, it's just a bit of a sidetrack. Stopping the clock though is bad. If you could determine that you were the last bean in the RenderGroup, maybe you could stop it, but it's best to just leave it running at the moment.
protected boolean performCleanup() {
state = null;
try {
if (clock != null) {
// clock.requestStop();
clock.remove(this);
// clock.dispose();
clock = null;
}
return true;
} catch (Exception failedCleanup) {
System.out.println("Yup exception. " + failedCleanup);
failedCleanup.printStackTrace();
}
return false;
}
#3) Here's a log trace of Timezone 3 using the Head and JMeter with 10 clients starting over 10 seconds. It's not too bad, we only get 4 RenderManager instances. In 1.6.2 I'd get 7 or 8 because it takes forever to instantiate the RenderManager. So that's a bad race condition. Ted says that this is likely our meddling with things, but I don't know any details. Over time, 3 of these RenderManager instances and the associated RenderHubs are GC'd. BUT Not the RenderThreads. They persist for the lifetime of the application. So one RenderHub wins, and its' threads are the ones that are used, but in this case, the other (3 * 15 = 45 ) Threads persist until the server is shut down. If they ever executed a RunnableRender, then they have a ThreadLocal reference that is never released.
class: javax/servlet/Servlet.class
29-Feb-2008 3:20:42 PM com.icesoft.faces.application.D2DViewHandler <clinit>
INFO:
ICEsoft Technologies, Inc.
ICEfaces x.x.x
Build number: x
Revision: x
29-Feb-2008 3:20:43 PM org.apache.coyote.http11.Http11BaseProtocol start
INFO: Starting Coyote HTTP/1.1 on http-8080
29-Feb-2008 3:20:44 PM org.apache.jk.common.ChannelSocket init
INFO: JK: ajp13 listening on /0.0.0.0:8009
29-Feb-2008 3:20:44 PM org.apache.jk.server.JkMain start
INFO: Jk running ID=0 time=0/31 config=null
29-Feb-2008 3:20:44 PM org.apache.catalina.storeconfig.StoreLoader load
INFO: Find registry server-registry.xml at classpath resource
29-Feb-2008 3:20:44 PM org.apache.catalina.startup.Catalina start
INFO: Server startup in 5047 ms
29-Feb-2008 3:20:55 PM com.icesoft.faces.async.render.RenderHub createScheduledService
INFO: scheduled render service created:
core pool size : 5
29-Feb-2008 3:20:55 PM com.icesoft.faces.async.render.RenderHub createScheduledService
INFO: scheduled render service created:
core pool size : 5
29-Feb-2008 3:20:55 PM com.icesoft.faces.async.render.RenderHub createScheduledService
INFO: scheduled render service created:
core pool size : 5
29-Feb-2008 3:20:55 PM com.icesoft.faces.async.render.RenderHub createScheduledService
INFO: scheduled render service created:
core pool size : 5
29-Feb-2008 3:20:56 PM com.icesoft.faces.async.render.RenderHub createCoreService
INFO: core render service created:
core pool size : 10
max pool size : 15
keep alive time: 300000
29-Feb-2008 3:20:56 PM com.icesoft.faces.async.render.RenderHub createCoreService
INFO: core render service created:
core pool size : 10
max pool size : 15
keep alive time: 300000
29-Feb-2008 3:20:56 PM com.icesoft.faces.async.render.RenderHub createCoreService
INFO: core render service created:
core pool size : 10
max pool size : 15
keep alive time: 300000
29-Feb-2008 3:20:56 PM com.icesoft.faces.async.render.RenderHub createCoreService
INFO: core render service created:
core pool size : 10
max pool size : 15
keep alive time: 300000
#4) Every time I see an accumulation of objects, the culprit is instances of PersistentFacesState being kept around in ThreadLocal references. JPRofiler doesn't let me find which threads are holding them, and all the ThreadLocals should be reused, over time. I have seen a large number of really odd ThreadLocal references though. From Catalina.shutdownHook objects to logFlushers, each with a ThreadLocal reference to PersistentFacesState. These too, I think go away over time, and it's just the nature of the JProfiler snapshot that catches them, I think.
We've put in disposing of the ThreadLocal references in RunnableRender after the lifecycle is executed and it has reduced the ThreadLocal reference to PFState from 15 to 1, but always, it seems, 1 remains. I'm not sure where that's being held. I think too, it is possible for HTTP threads to obtain ThreadLocal references and for the threads to skip their clearing code if rendering exceptions occur (which we've seen in 1). THere's no guarantee how often HTTP threads are going to be used, so it's possible for a Thread to sit idle for 'some time' during which the PFState object is held in memory.
Again, all of the references in 4 'should' be flushed over time and aren't necessarily pure evil. Just a distraction.
Ted mentioned asserting that the ThreadLocals on entry and exit of the MainServlet service methods and the RunnableRender methods are null, and catching them this way. This will have to be done with introspection though, as all the methods in the ThreadLocalMap are private.
Activity
- All
- Comments
- History
- Activity
- Remote Attachments
- Subversion
| Field | Original Value | New Value |
|---|---|---|
| Assignee Priority | P1 | |
| Assignee | Deryk Sinotte [ deryk.sinotte ] |
| Assignee | Deryk Sinotte [ deryk.sinotte ] | Greg Dick [ greg.dick ] |
| Attachment | Timezone3_icefaces-171-object-counts.jpg [ 10890 ] |
| Attachment | Timezone3-icefaces-171-heap-growth.jpg [ 10892 ] |
| Status | Open [ 1 ] | Resolved [ 5 ] |
| Fix Version/s | 1.7.1 [ 10122 ] | |
| Resolution | Fixed [ 1 ] |
| Security | Private [ 10001 ] |
| Status | Resolved [ 5 ] | Closed [ 6 ] |
| Assignee Priority | P1 | |
| Assignee | Greg Dick [ greg.dick ] |